Introduction
| Reference year | 2024 |
| Population (-) | 18,034,454 |
| Population density (inhabitants per km2) | 527 |
| Number of distinct collection areas (-) | 369 |
| Amount of separately collected organics streams (t per year): | 2,094,706 |
| ↳ Thereof biowaste waste stream (t per year) | 1,282,871 |
| ↳ Thereof green waste stream (t per year) | 811,835 |
| Amount of collected residual waste (t per year) | 3,209,298 |
| Total organics streams separation rate (%) | 65.3 |
| Biowaste stream separation rate (%) | 40.0 |
| Biowaste recycling rate (%) | 97 |
| Total recycling rate (%) | - |
Note: Key Performance Indicators and Influencing Factors are defined on the project website: Link
Waste collection organisation in Rhineland-Palatinate
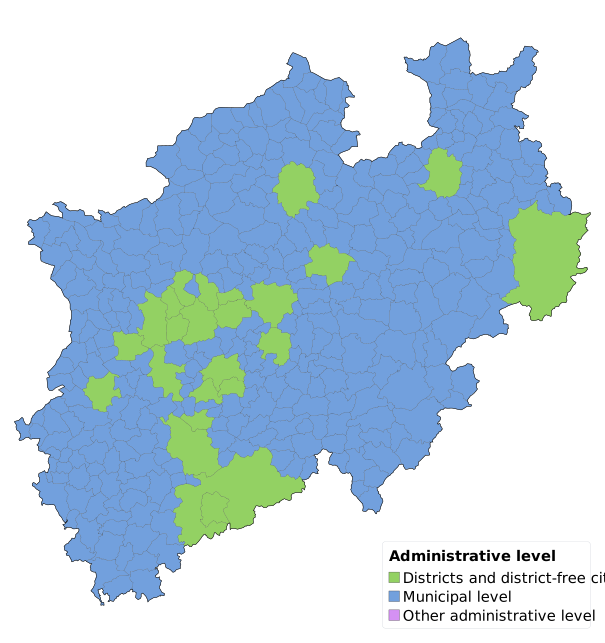
Waste collection in North Rhine-Westphalia (NRW) is mainly organised at municipal level (Figure 1). In a few districts, the actual responsibility for waste collection and transport has been transferred from the municipalities to the district (see Infobox 1). In total, there are 369 distinct collection areas.
Infobox 1: Waste management organisation in North-Rhine Westphalia
In NRW, responsibilities are divided between different administrative levels in accordance with Section 5 of the State Circular Economy Act of North Rhine-Westphalia. Districts and district-free cities are generally defined as public waste management authorities and are therefore responsible for the overall waste management concept as well as for treatment and disposal infrastructure. However, in the district-affiliated municipalities, the collection and transport of household waste are generally the responsibility of the municipalities themselves. The shared allocation of responsibilities is, for example, described in the waste management concept of the District of Borken (2022).
This organisational structure differs from the more common German model, where municipal waste management responsibilities are generally concentrated at the level of districts and district-free cities (NUTS 3 level).
Biowaste stream quantities
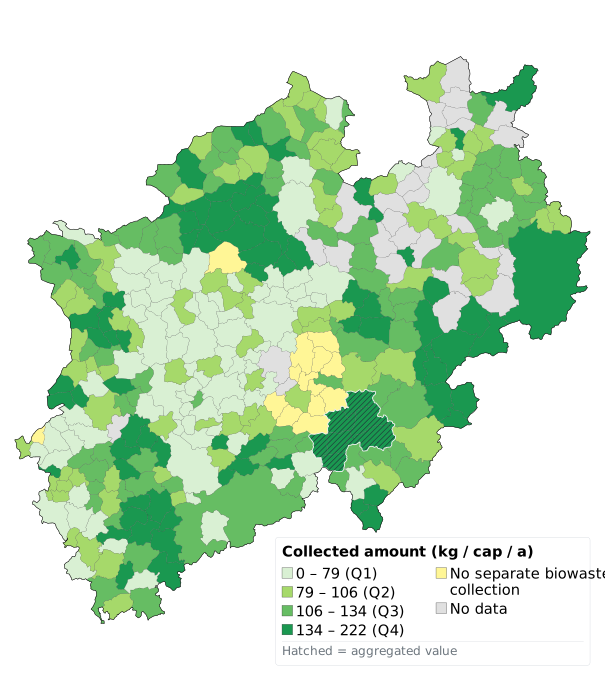
The mean quantity of separately collected biowaste was 102 ± 44 kg per inhabitant and year (median = 105), with a minimum of 0, and a maximum of 222 (Figure 2).
Infobox 2: Separate collection of biowaste in North Rhine-Westphalia
Separate collection of biowaste is mandatory under the German Circular Economy Law since 2015. In NRW, however, there is no uniform state-wide obligation for municipalities to offer a mandatory biobin. Whether the biobin is mandatory or voluntary is defined locally by municipal statutes and is further assessed in the dedicated NRW factsheet on participation policy and population connection rate.
As for most of Germany, food waste and garden waste are collected as commingled biowaste in NRW. In addition, most districts offer additional bring schemes for green waste. Residual waste is collected door-to-door from all households in NRW.
Door-to-door separate collection of biowaste is available to 94.3% of the population, covering 348 collection areas. For 3.8% of the population, no separate collection option is provided (14 areas), mainly municipalities of the district of Märkischer Kreis in central NRW (Figure 2). The remaining population is served by bring schemes, such as open street containers or municipal recycling centres. However, in many of these areas, the reported collected quantities are negligible, indicating the formal rather than effective provision.
Residual waste stream quantities
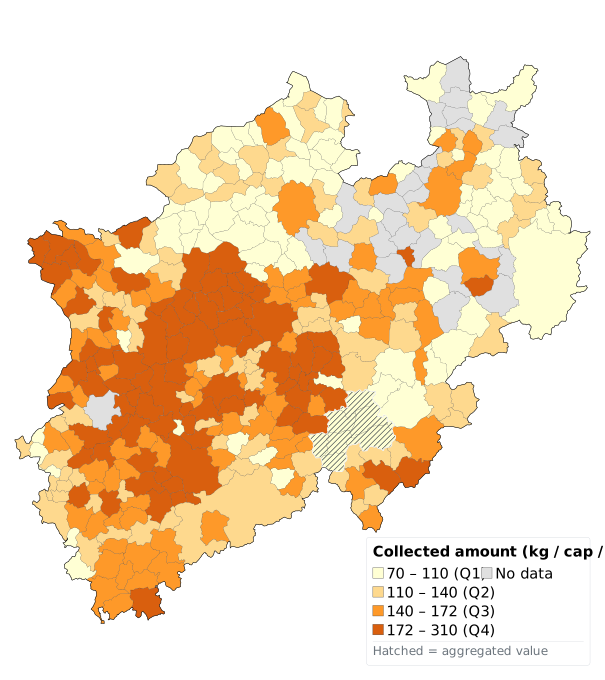
The mean quantity of collected residual waste was 146 ± 44 kg per inhabitant and year (median = 141), with a minimum of 68, and a maximum of 310 (Figure 3).
Biowaste stream separation rate
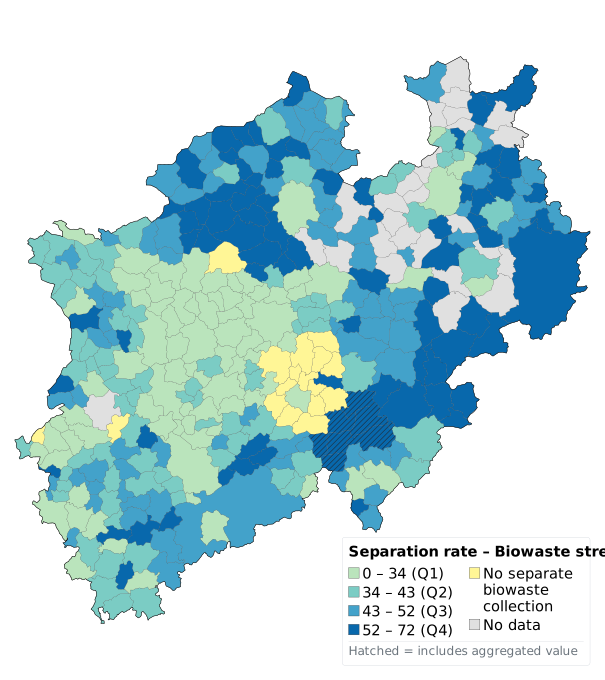
The biowaste stream separation rate (SRBW,gross) indicates for most collection areas a residual bin dominant collection (Figure 4). Mainly located in northern and eastern parts of NRW, there are 94 municipalities (11% of population) collecting a larger share of waste via the biowaste bin compared to the residual waste bin (SR ≥ 50%). The mean SRBW,gross was 41 ± 15% (median = 43%), with a minimum of 0%, and a maximum of 72%.
Associated Fact Sheets
→ Click on the tiles to read or download the full factsheet