Introduction
| Reference year | 2024 |
| Population (-) | 10,587,710 |
| Population density (inhabitants per km²) | 24 |
| Number of distinct collection areas (-) | 254 |
| Amount of separately collected organics streams (t per year): | 855,929 |
| ↳ Thereof food waste stream (t per year) | 460,806 |
| ↳ Thereof green waste stream (t per year) | 395,123 |
| Amount of collected residual waste (t per year) | 1,513,680 |
| Total organics streams separation rate (%) | 36.1 |
| Biowaste stream separation rate (%) | 57 |
| Biowaste recycling rate (%) | 83 |
| Total recycling rate (%) | 46 |
Note: Key Performance Indicators and Influencing Factors are defined on the project website: Link
Waste collection organisation in Sweden
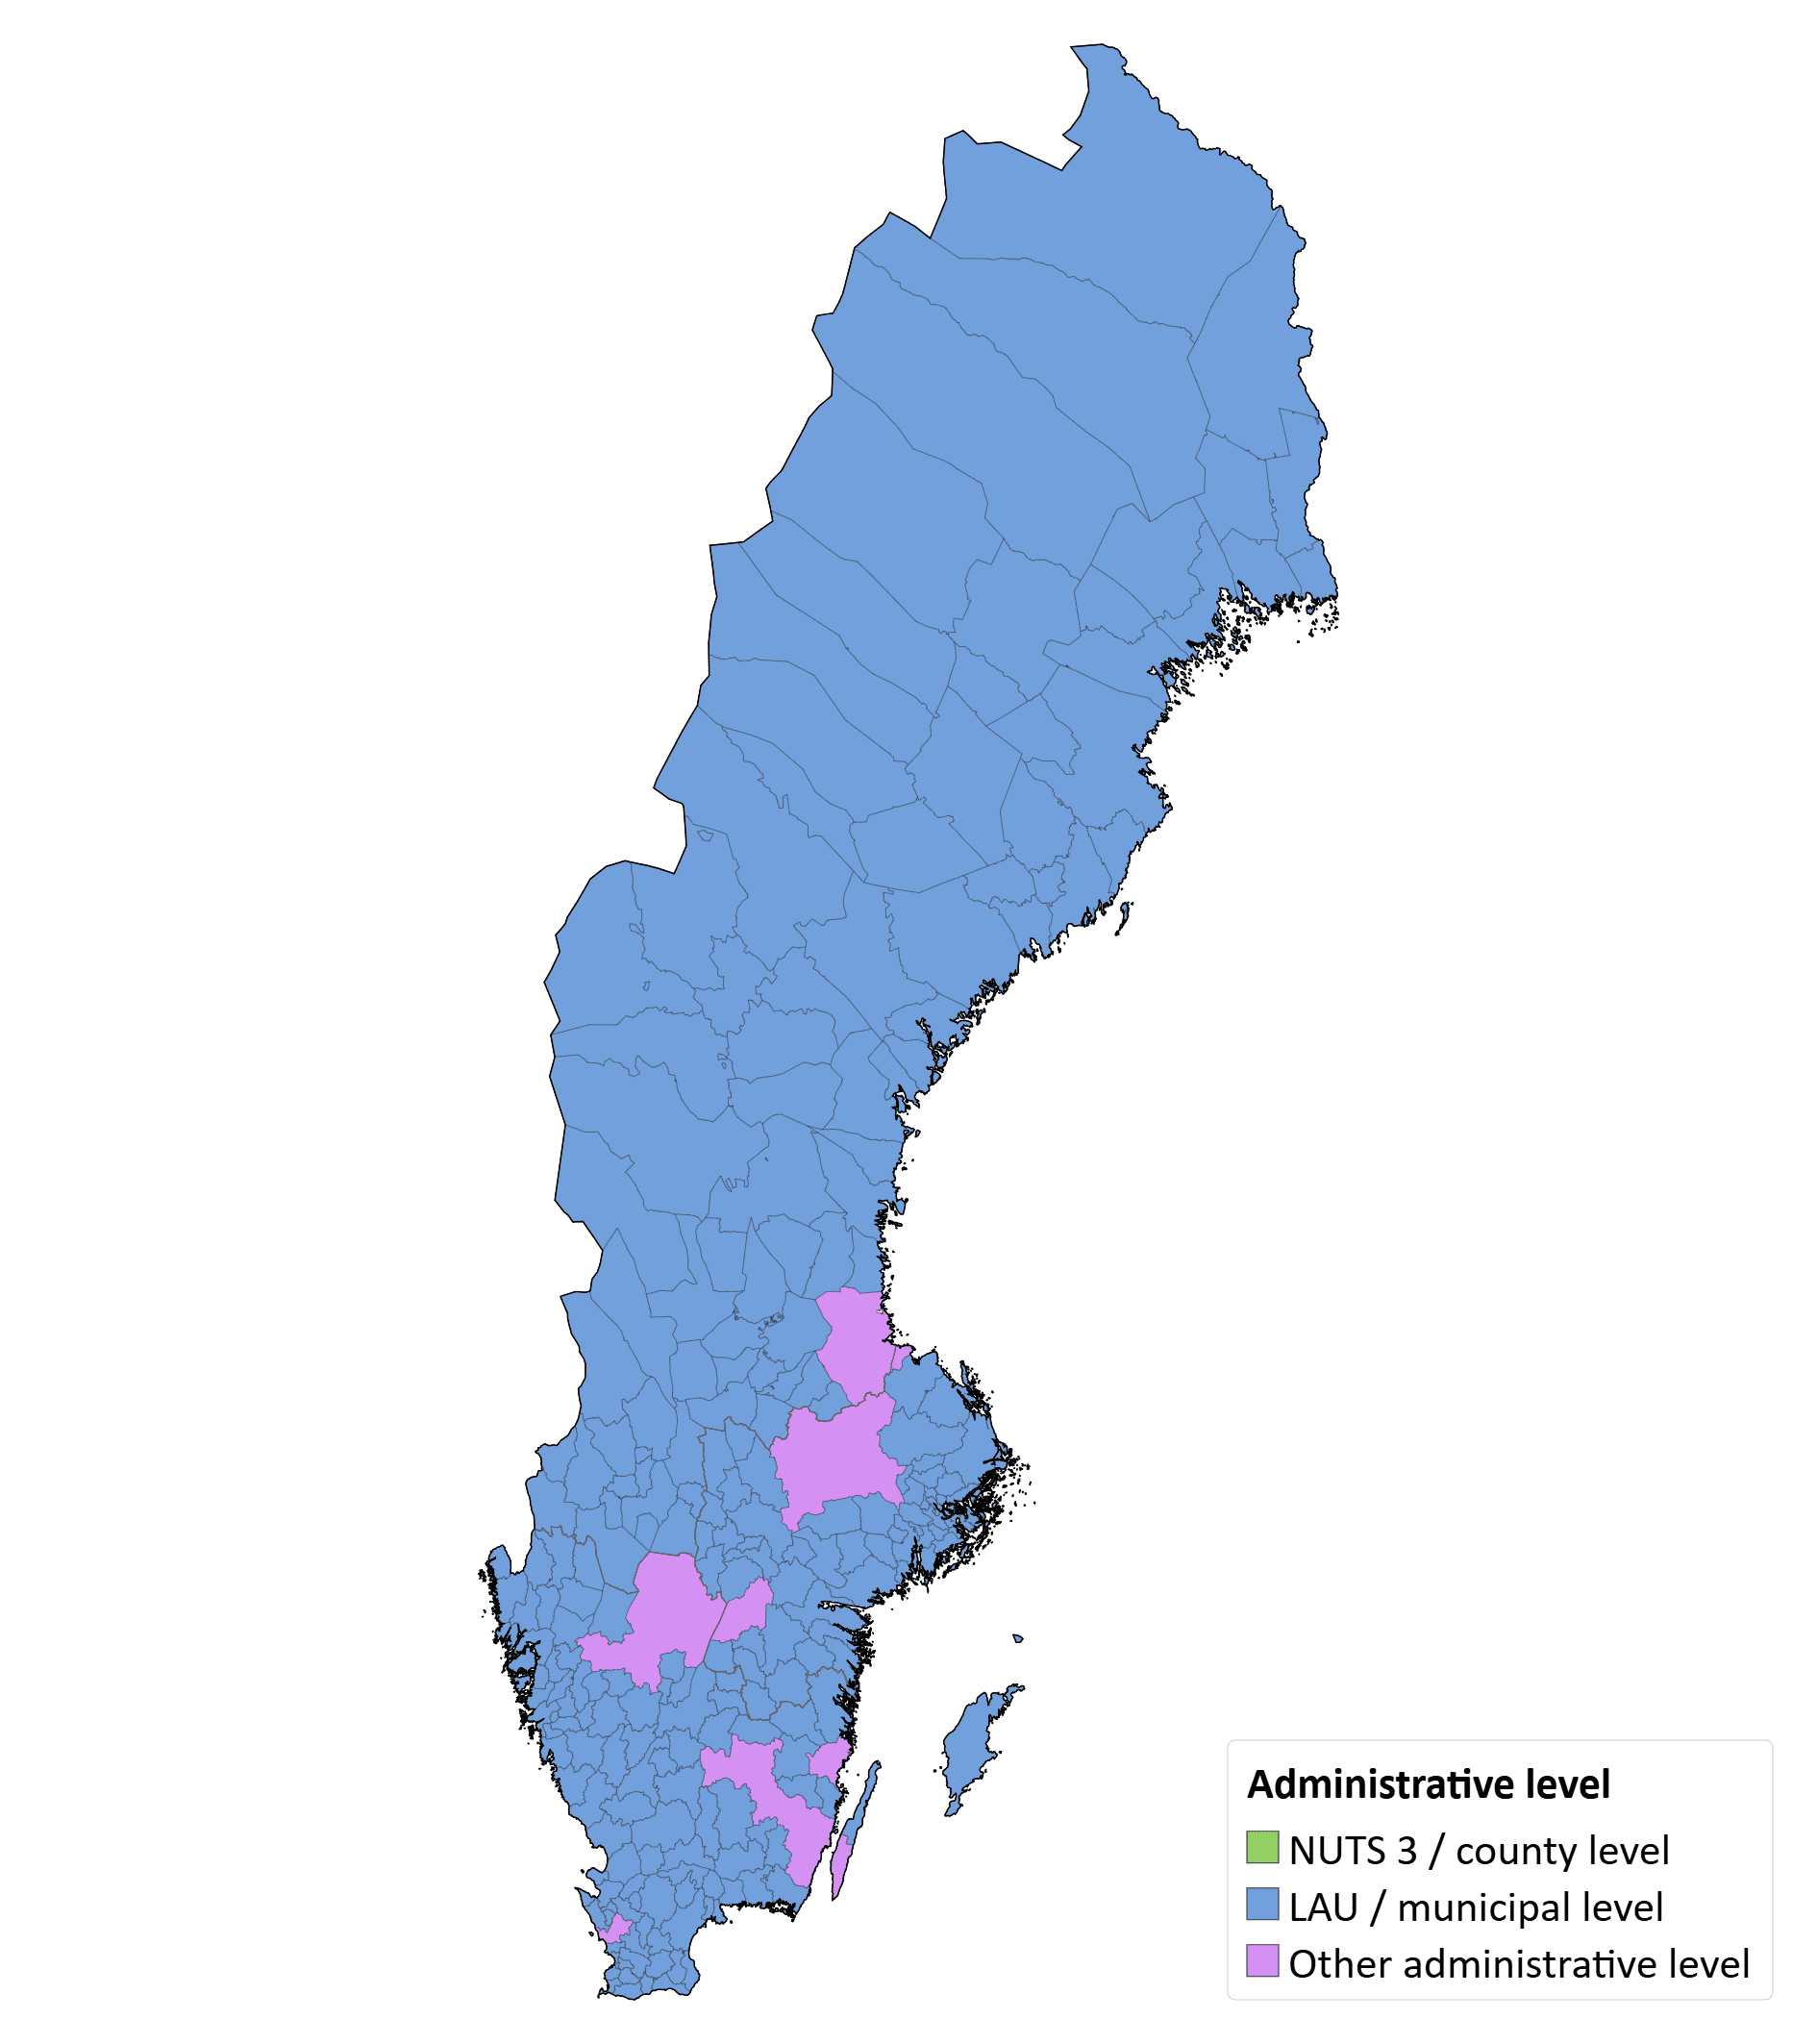
As shown in Figure 1, Sweden primarily organises waste collection at a municipal level. In southern Sweden, however, some municipalities have formed a consortium to manage waste jointly. In total, there are 254 distinct waste collection areas.
Food waste stream quantities
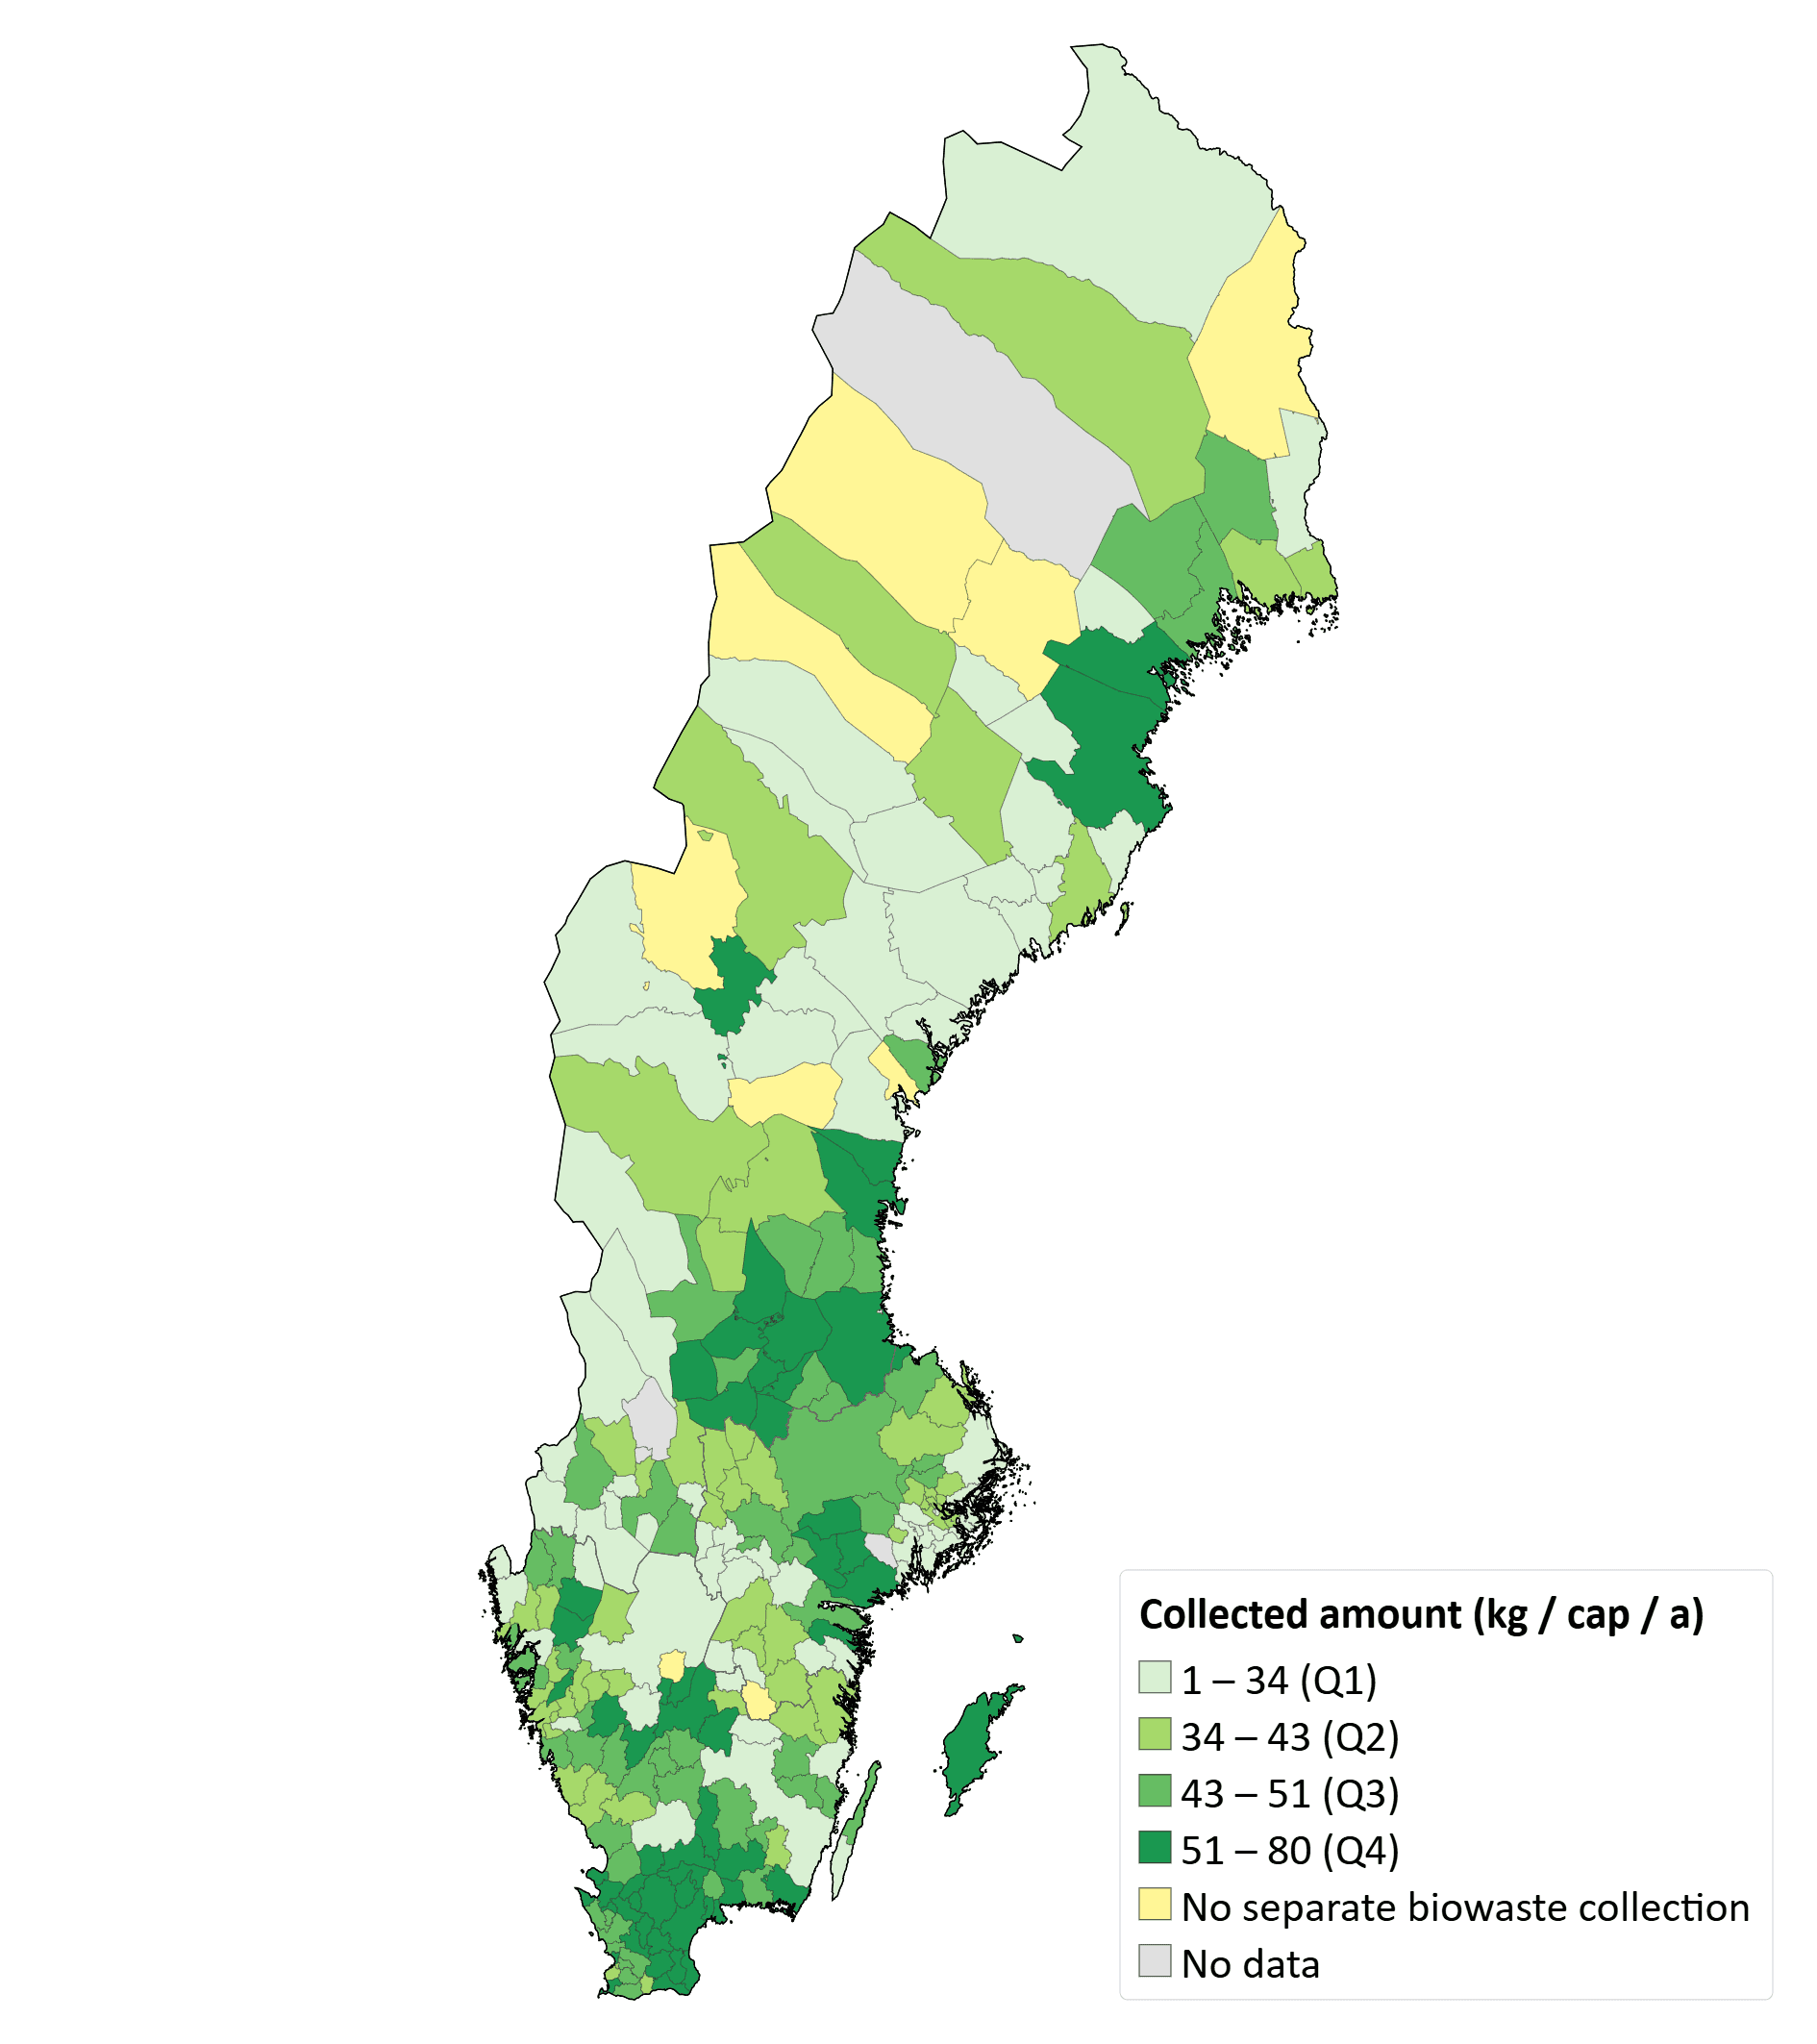
The mean quantity of separately collected biowaste was 42 ± 13 kg per inhabitant and year (median = 43), with a minimum of 1, and a maximum of 80 (Figure 2).
Infobox: Separate collection of food waste in Sweden
Separate collection from households and businesses is mandatory since the beginning of 2024. Not only that, the mandate also requires property-close collection, i.e. door-to-door collection (“fastighetsnära”). Municipalities can only postpone implementation if Naturvårdsverket grants a time-limited dispensation based on specific legal grounds such as technical infeasibility, unreasonable cost, or better overall environmental performance of another solution.
Food waste is collected separately as a single-stream fraction in Sweden. Additional collection for green waste exists. Door-to-door separate collection of food waste is offered to 99.3% of the population (245 collection areas), and 0.7% are not offered any option for separate collection for it.
Residual waste is collected door-to-door from all households in Sweden.
Residual waste stream quantities
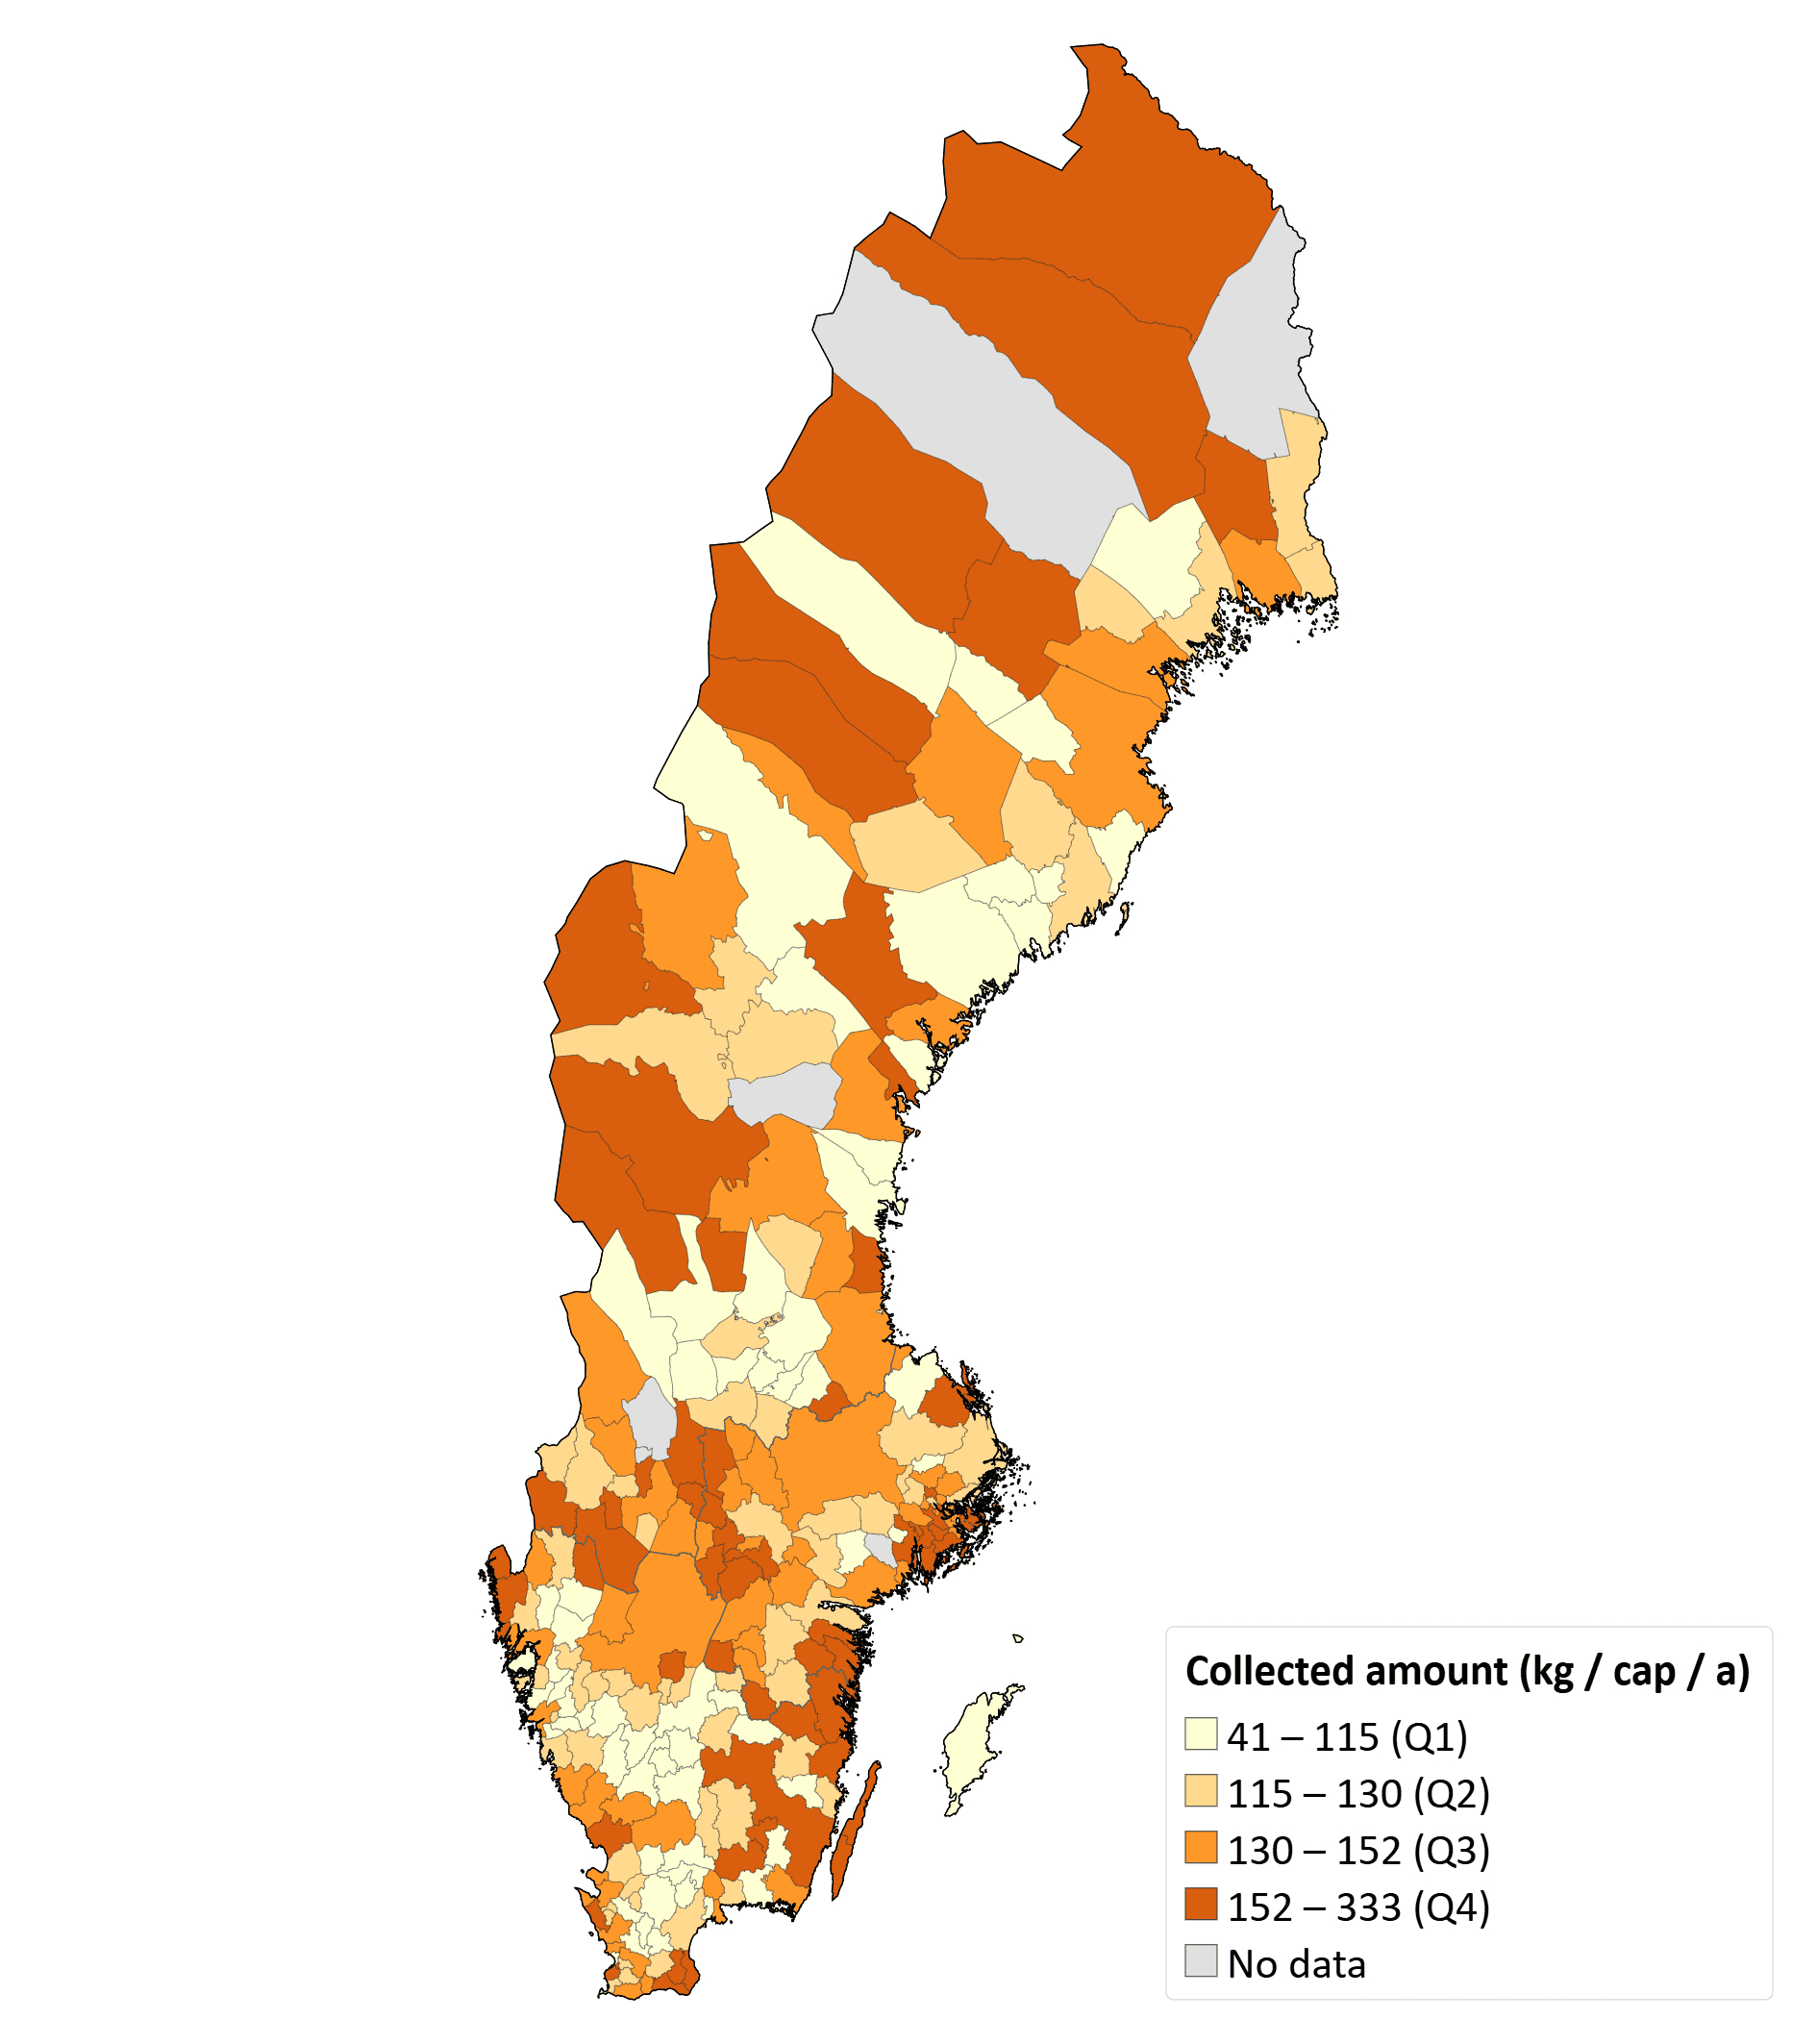
The mean quantity of collected residual waste was 136 ± 34 kg per inhabitant and year (median = 131), with a minimum of 41, and a maximum of 333 (Figure 3).
Biowaste stream separation rate
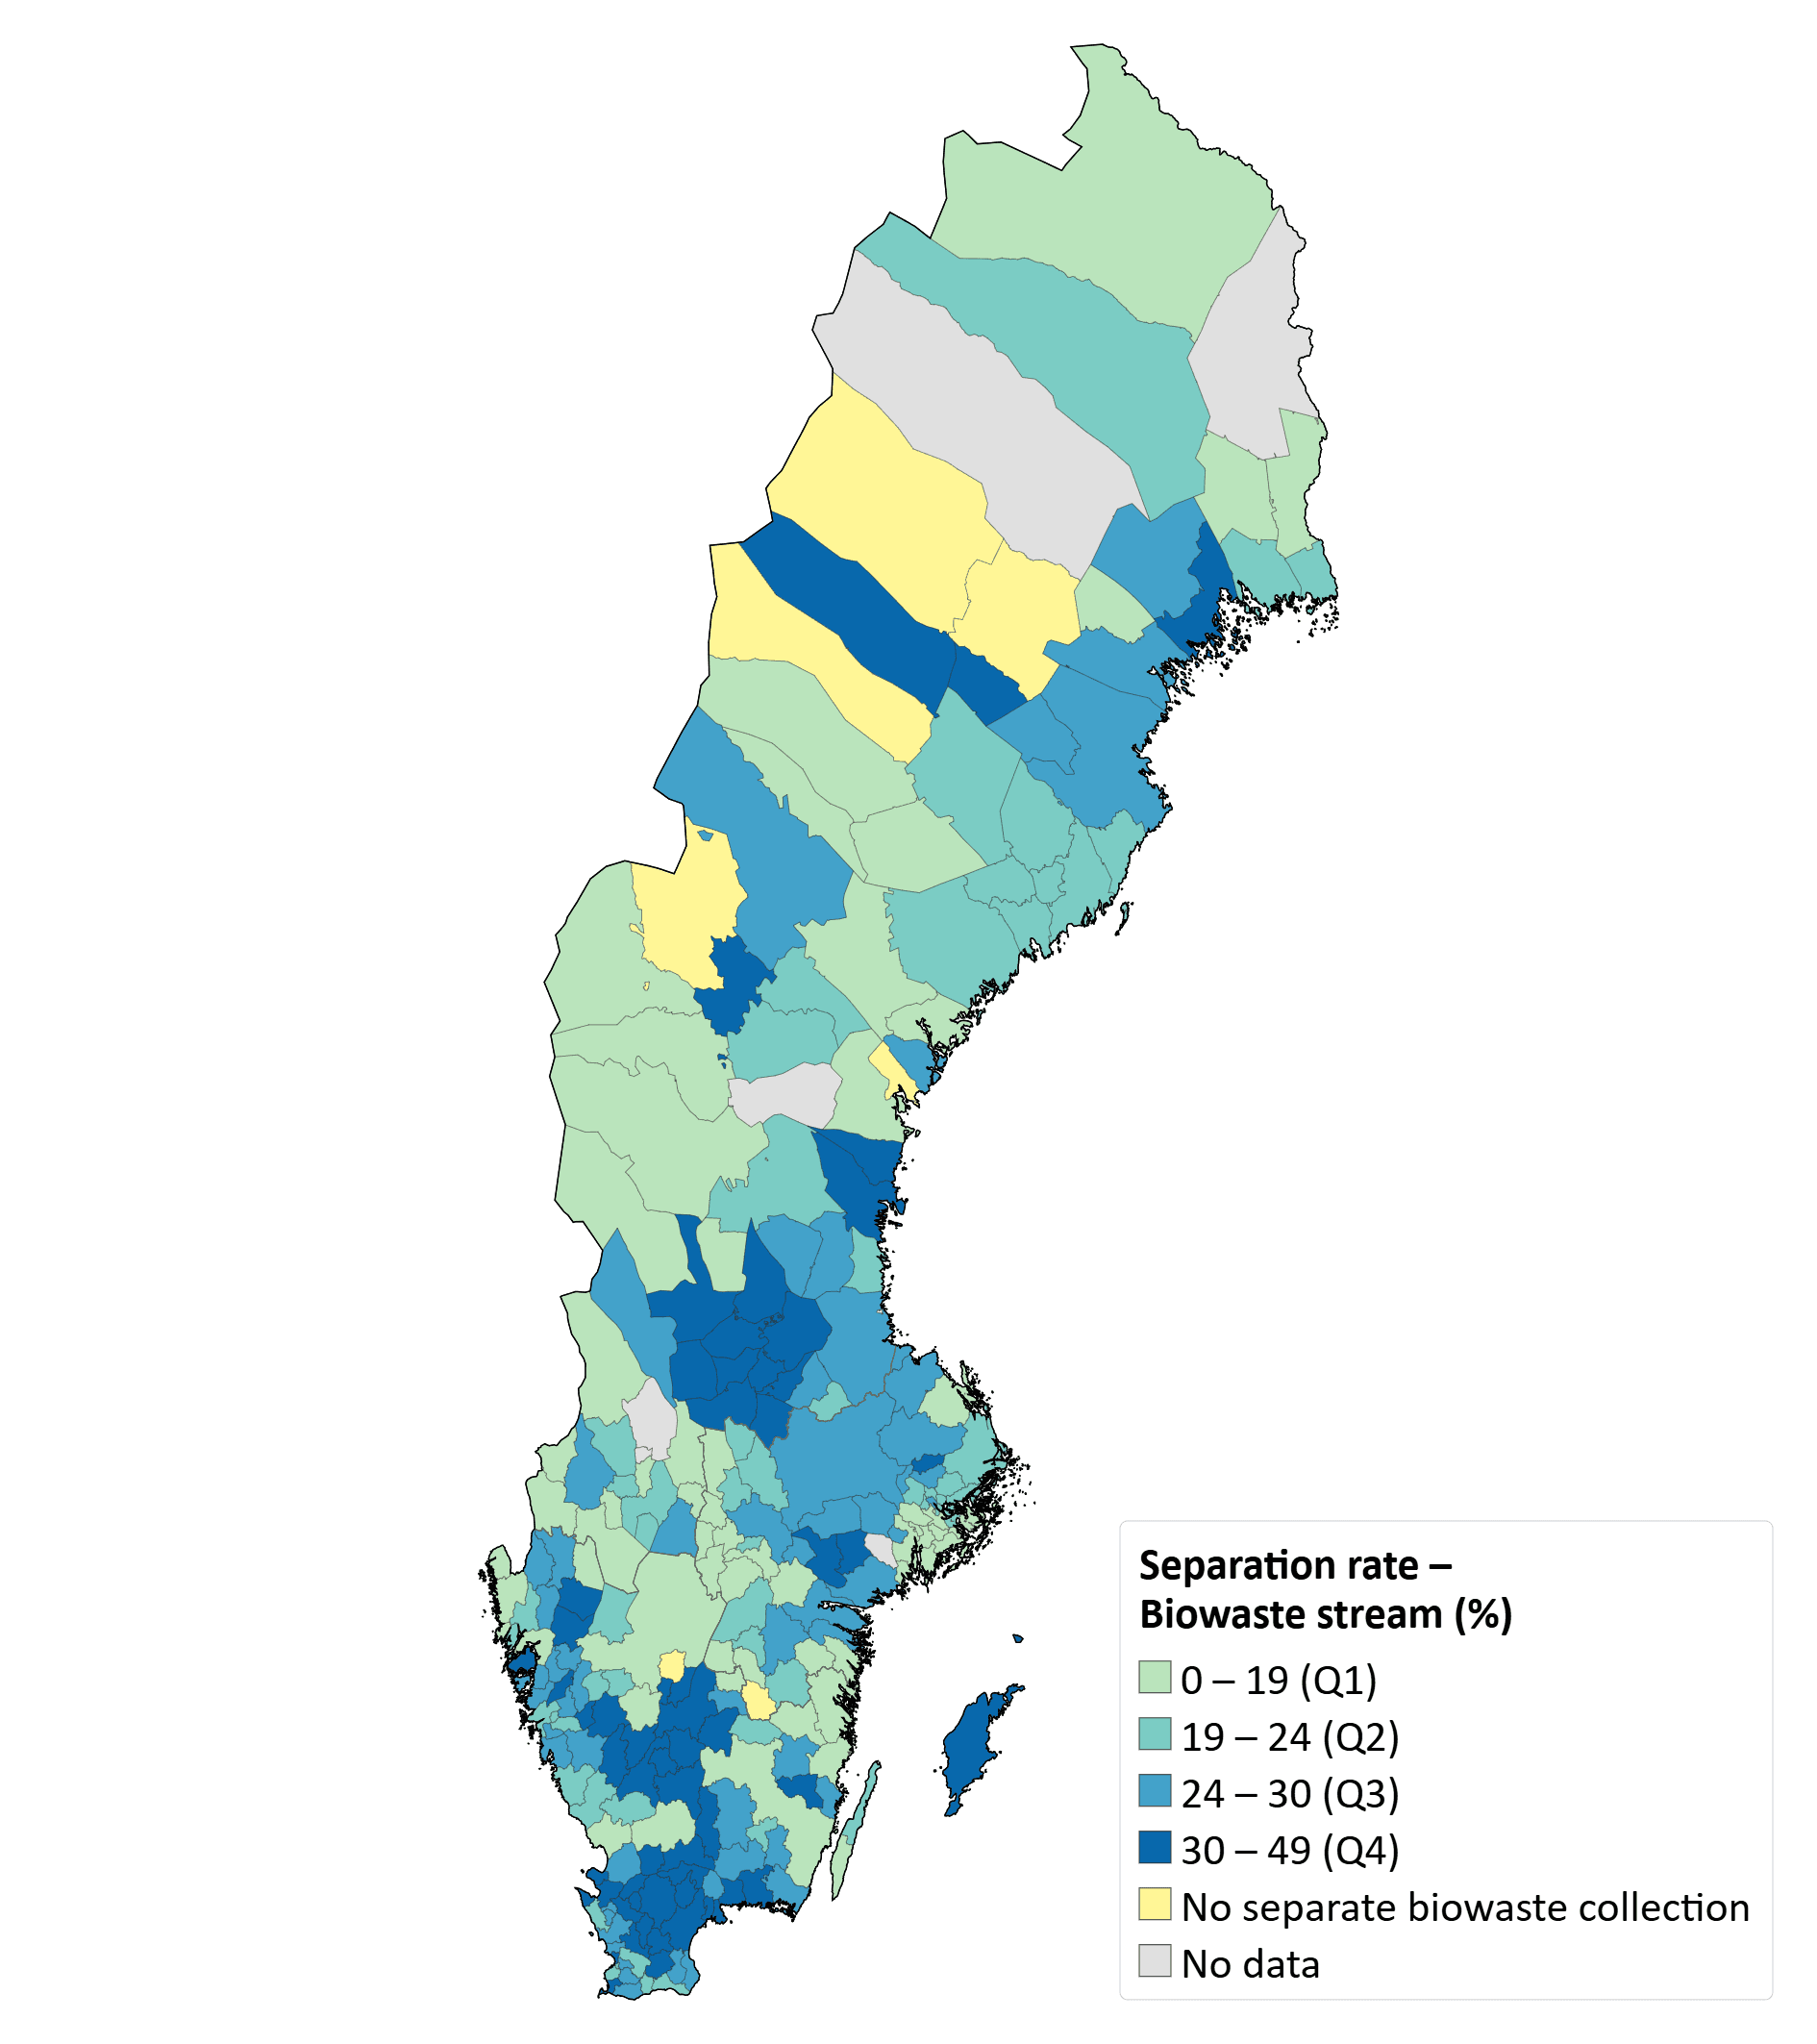
The biowaste stream separation rate (SRBW,gross) indicates for all collection areas a residual-waste-dominant collection (Figure 4). The mean SRBW,gross was 24 ± 8 % (median = 24), with a minimum of 1, and a maximum of 49.
Associated Fact Sheets
→ Click on the tiles to read or download the full factsheet