
Purpose
A reliable assessment of biowaste separate collection performance requires information on both separately collected biowaste and the amount of biowaste remaining in the residual waste stream. However, residual waste composition data are often not available for all collection areas, as sorting analyses are resource-intensive and typically conducted only for selected areas and reference years.
This methodological note examines whether routinely available waste-stream-based KPIs can be used to approximate material-based biowaste performance indicators. The focus is on the relationship between the biowaste stream separation rate and an approximated biowaste separation rate derived from residual waste composition data. Both KPIs are defined in the respective project methodology section.
The results are not intended as a universal conversion model, but to demonstrate how locally available waste composition analyses can be used to derive region-specific relationships between KPIs and support the estimation of actual biowaste separate collection performances.
Methodology
The analysis was conducted for selected case study regions where both waste-stream data and residual waste composition data were available.
The following KPIs were applied:
- biowaste stream separation rate (SRBW,gross)
- approximated net biowaste separation rate (SRBW,approx)
The calculation of these KPIs is described in the project methodology section.
The relationship between both indicators was assessed using Pearson’s correlation coefficient and simple linear regression. SRBW,gross was used as the predictor variable, while SRBW,approx was used as the response variable.
Case studies
1) Rhineland-Palatinate
The assessment included 27 collection areas.
A very strong positive correlation was observed between SRBW,gross and SRBW,approx-net (Figure 1). The linear model explained 94% of the variation in the approximated separation rate (R² = 0.94). Each one-percentage-point increase in SRBW,gross is associated with an estimated 1.25-percentage-point increase in SRBW,approx-net, as indicated by the regression equation.
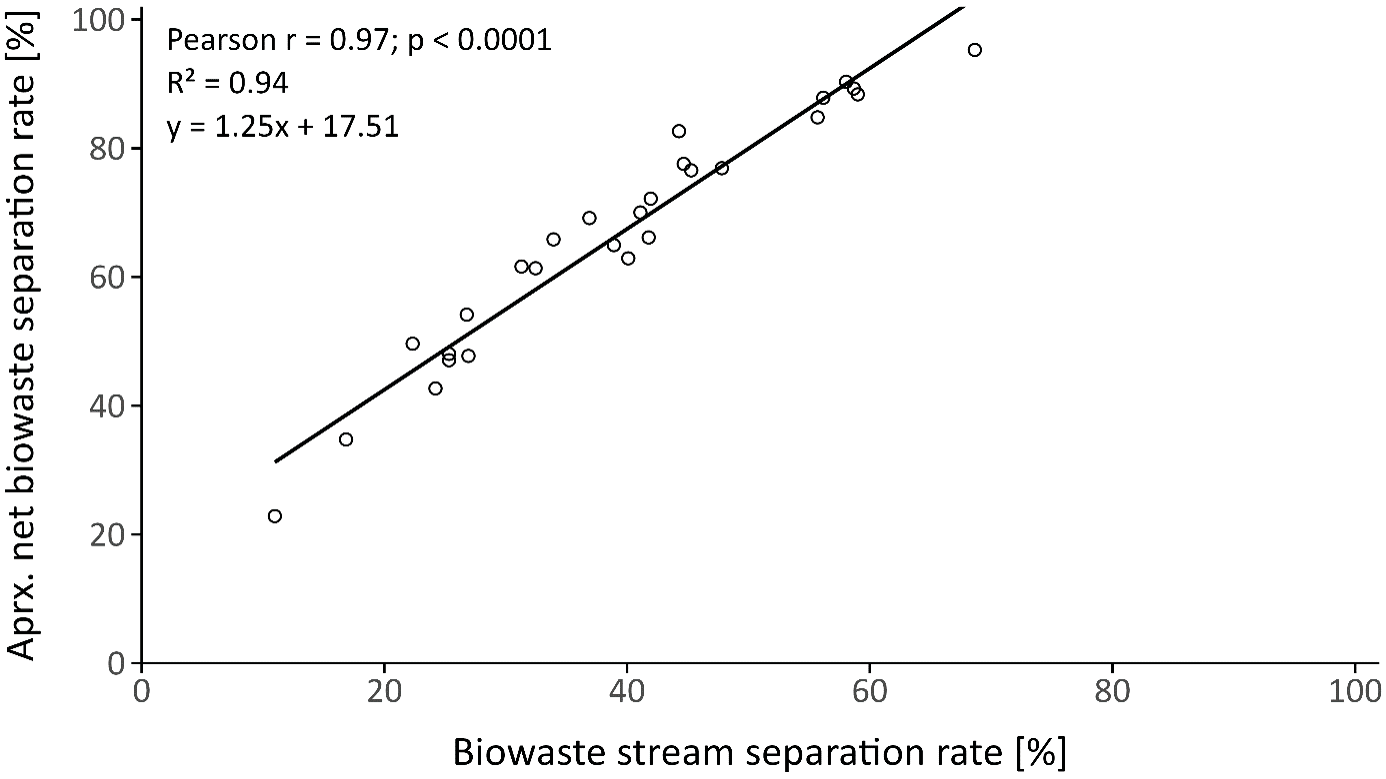
These results indicate that SRBW,grosss provides a strong approximation of SRBW,approx-net. within the analysed dataset. However, individual estimates may still differ from the observed values by several percentage points.
2) Province of Bolzano – South Tyrol
The assessment included seven supra-municipal collection areas.
A very strong positive correlation was observed between SRBW,gross and SRBW,approx-net (Figure 2). The linear model explained 87% of the variation in the approximated separation rate (R² = 0.87). Each one-percentage-point increase in SRBW,gross is associated with an estimated 0.4-percentage-point increase in SRBW,approx-net, as indicated by the regression equation.
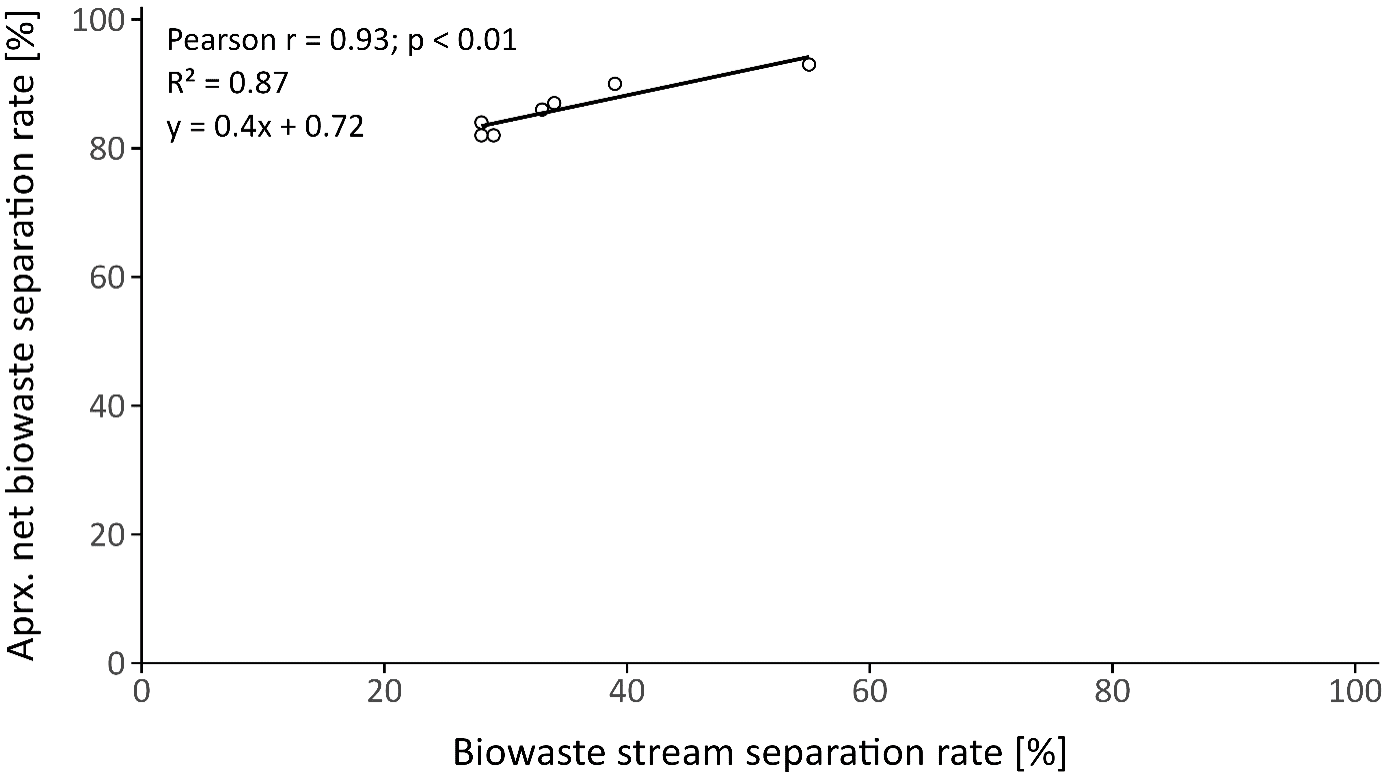
The results confirm a strong relationship between the two indicators within the analysed dataset. However, the smaller sample size, the supra-municipal level of assessment and the clear distinction between areas targeting food waste and those collecting commingled biowaste should be considered when interpreting the model and comparing it to other case studies.
Interpretation and transferability
The case studies indicate a strong empirical relationship between waste-stream-based and material-based biowaste performance indicators. SRBW,gross may therefore support the estimation of SRBW,approx-net where residual waste composition data are unavailable for every collection area.
The different regression slopes show that the relationship is region-specific. It may be influenced by:
- residual waste composition and the methodology and scope of the sorting analyses
- overall waste generation levels,
- collection system design, e.g. food waste or commingled biowaste collection,
- additional green waste collection systems and its configuration,
- household participation and capture efficiency,
- prevalence of home composting,
- separate or combined collection of household and commercial waste.
The approach is therefore transferable as a methodological framework, but not as a fixed model. Other regions may apply it where waste-stream data are available for a larger number of collection areas and residual waste composition data exist for a representative subset. This requires consistent KPI definitions and composition analysis methods, representative collection areas and validation of the resulting local regression model.
Limitations of the analysis
The regression models are valid only for the assessed case study regions due to the highlighted potential differences in underlying key aspects of waste composition analysis methodology, KPI definitions and collection system aspects. This may lead to systematic over- or underestimation when a model is transferred between regions, as illustrated by the different regression slopes of the presented case studies.
The models are also limited to the observed data range and should not be extrapolated beyond it. Residual waste analyses should therefore cover a representative range of collection systems and performance levels.
Key conclusion
Waste-stream-based separation rates can serve as strong proxies for material-based biowaste performance indicators when calibrated against local residual waste composition data. The main value of the approach lies in its methodological transferability. Regions can use existing KPI definitions and a limited number of composition analyses to derive locally valid estimation models, rather than relying on a universal conversion factor.