

Introduction
The project “Integrated information and management tool for analysing the potential of biowaste in the European Union” funded by the DATIpilot programme of the German Federal Ministry of Research, Technology and Space travel (Bundesministerium für Forschung, Technologie und Raumfahrt BMFTR) aims at identifying detailed key data on municipal biowaste collection. The focus of the project is to assess key performance indicators (KPIs) and to identify their influencing factors (IF). With this analysis best practices in biowaste collection can be identified and turned into policy recommendations.
The ECN and the Hamburg University of Technology (TUHH) are the project partners. The project started in December 2024 and finished May in 2026.
Project Concept
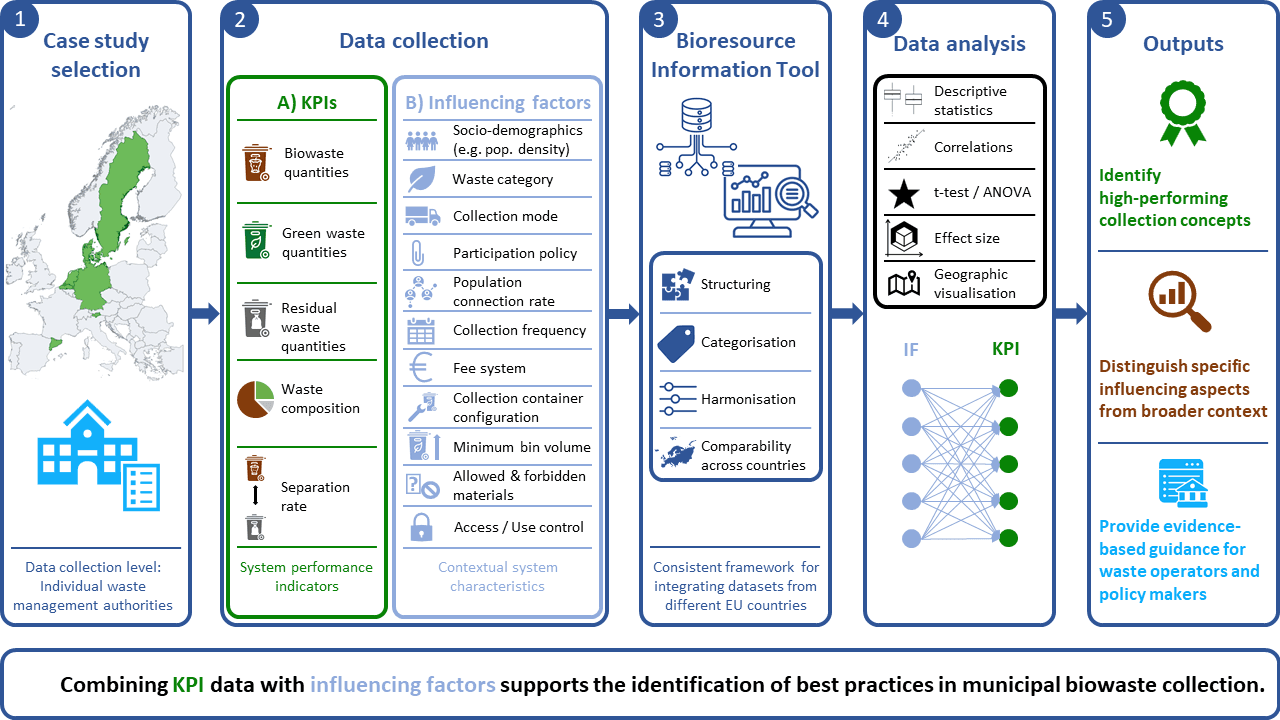
The BRIT-EU project was designed to support the identification of high-performing biowaste collection concepts, distinguish the effects of specific system characteristics from broader contextual conditions, and provide evidence-based guidance for waste management stakeholders, including municipalities and regions in charge of organising waste collection, waste operators and policy makers. The methodological concept is summarised in the figure “BRIT-EU Research Framework” below and consists of five main steps.
The first step, case study selection, refers to the selection of countries or regions included in the analysis. Case studies were selected based on existing contacts in the respective regions, data availability, the relevance and diversity of the local waste collection landscape, the development of KPIs in recent years, and the political development in circular economy and waste management, particularly in relation to obligations under the EU Waste Framework Directive.
The second step, Key Performance Indicator and Influencing Factor definition and data collection, included the definition of KPIs and IFs as well as of the categories of the latter. This process was followed by the collection of quantitative and qualitative data on biowaste and residual waste collection systems.
The third step, data processing and integration into the Bioresource Information Tool (BRIT), included the structuring, categorisation and harmonisation of the collected data. This step aimed to improve the comparability of datasets from different EU countries and regions and to develop a consistent framework for integrating heterogeneous data sources. Organising the data in the BRIT additionally allows to publish and share the collected data and analysis with stakeholders.
The fourth step, data analysis, comprised the statistical evaluation and comparative interpretation of the processed data. The statistical methods applied are described in the respective section below.
The fifth step, use of results, describes the identification of best-practice collection concepts, the assessment of relationships between performance indicators and influencing factors, and the derivation of evidence-based recommendations for the planning and optimisation of biowaste collection systems.
The main outputs of the project are influencing factor factsheets. Each influencing factor factsheet focuses on one or two influencing factors within one case study region. Several influencing factors may be analysed for the same case study region.
Their purpose is to describe existing local practices and to support the identification of best practices that may guide municipalities, waste management organisations and policy makers in designing or improving collection systems. While some influencing factors are only relevant in specific national or regional contexts, the combined findings provide an evidence base for comparing system elements across different local conditions. In this way, the factsheets can support the development of collection schemes that maximise separately collected biowaste, minimise residual waste, and contribute to the definition of realistic but ambitious future targets.
In addition, each case study region is described in an overview factsheet. These provide contextual information and summarise KPIs for the respective case study region.
The influencing factor factsheets follow a common structure: results summary, introduction, descriptive statistics and maps, statistical assessment, and conclusion.
Fact Sheets
→ Click on the tiles to read or download the full factsheet

Case Study Profiles
→ Click on the tiles to read the full profile


Key Performance Indicators (KPI)
The standard KPIs used in this project are waste-stream based, unless stated otherwise. Where data on waste composition are available, selected KPIs can also be expressed as material-based indicators.
▼ Biowaste stream (BW)
Describes separately collected biowaste, commonly collected via the biobin. It is typically expressed in tonnes per year or kg per inhabitant per year. A distinction is made between the following sub-categories:
- Gross biowaste (BWgross): Total waste collected in the biowaste stream, including food waste, green waste, accepted collection aids and impurities.
- Net biowaste (BWnet): Compliant target biowaste materials such as food waste and green waste.
▼ Green waste stream (GW)
Describes separately collected green waste outside the biowaste stream (biobin). It is typically expressed in tonnes per year or in kg per inhabitant per year.
A distinction is made between the following sub-categories:
- Gross green waste (GWgross): Total waste collected in the green waste stream, including green waste, accepted collection aids and non-compliant materials, commonly defined as impurities.
- Net green waste (GWnet): Compliant target green waste materials collected in the green waste stream, including garden and park waste such as leaves and grass clippings.
▼ Total organics streams (TOS)
Describes the sum of all separately collected organic waste streams, including the biowaste stream and additional green waste streams. It is typically expressed in tonnes per year or in kg per inhabitant per year.
A distinction is made between the following sub-categories:
- Gross total organics streams (TOSgross): Total waste collected through all separate organic waste collection streams, including food waste, green waste, accepted collection aids and non-compliant materials, commonly defined as impurities.
- Net total organics streams (TOSnet): Compliant target organic materials collected through all separate organic waste collection streams, including food waste and green waste.
▼ Residual waste stream (RW)
Describes the mixed residual waste stream and includes waste that is not separately collected. It may therefore also contain recyclable or organic materials that could have been captured through separate collection. It is typically expressed in tonnes per year or in kg per inhabitant per year.Unlike separate target streams, the residual waste stream is not divided into gross and net quantities in this methodology. Instead, the total residual waste stream and specific material fractions within it are distinguished where composition data are available.
A distinction is made between the following sub-categories:
- Residual waste (RW): Total waste collected in the residual waste stream
- Biowaste in residual waste (BWRW): Biowaste fraction found in the residual waste stream, including food waste and green waste.
- Food waste in residual waste (FWRW): Food waste fraction found in the residual waste stream.
- Green waste in residual waste (GWRW): Green waste fraction found in the residual waste stream.
▼ Separation rate (SR)
The separation rate is an indicator that relates separately collected waste streams to unsorted waste collected in the residual waste stream. It accounts for the interdependency between separate collection and residual waste generation, rather than focusing solely on individual waste quantities. Depending on the available information on waste quantities and composition, different separation rates can be calculated. Waste-stream-based separation rates compare total collected waste streams, while material-based separation rates compare specific material fractions within these streams.
Separation rate – Total organics streams (SRTOS,gross)
Compares the total quantities collected through separate organic waste collection streams with the total quantities collected in the residual waste stream.

where
mBW,gross is the total mass collected in the biowaste stream, expressed as kg per inhabitant and year or as total tonnes,
mGW,gross is the total mass collected in the green waste stream, expressed as kg per inhabitant and year or as total tonnes, and
mRW is the total mass collected in the residual waste stream, expressed as kg per inhabitant and year or as total tonnes.
Separation rate – Biowaste stream (SRBW,gross)
Compares the total quantities collected in the biowaste stream with the total quantity collected in the residual waste stream.

This is the main separation rate KPI used in this project, as the analysis focuses on the relationship between biowaste and residual waste collection systems and influencing factors.
Separation rate – Net biowaste (SRBW,net)
Describes the share of target biowaste materials collected separately in the biowaste stream compared with the biowaste remaining in the residual waste stream. It therefore focuses on actual biowaste quantities.
Calculation of the net biowaste separation rate requires composition data for both relevant waste streams.

where
mBW,net is the mass of biowaste materials collected in the biowaste stream, expressed as kg per inhabitant and year or as total tonnes, and
mBW,RW is the mass of biowaste found in the residual waste stream, expressed as kg per inhabitant and year or as total tonnes.
An equivalent net separation rate can be calculated for total organic waste where additional separately collected green waste streams are included alongside the biowaste stream.
Separation rate – Approximation of net biowaste (SRBW,approx)
If composition data are available for the residual waste stream but not for the biowaste stream, an approximation of the net biowaste separation rate can be calculated. This indicator compares the total mass collected in the biowaste stream with the biowaste fraction remaining in the residual waste stream. It should be interpreted as an approximation, as the biowaste stream is not corrected for non-compliant materials.
where
mBW,gross is the total mass collected in the biowaste stream, expressed as kg per inhabitant and year or as total tonnes, and
mBW,RW is the mass of biowaste found in the residual waste stream, expressed as kg per inhabitant and year or as total tonnes.
▼ Impurities
Depending on the local context, varying materials can be defined as non-compliant.
Influencing Factors (IF)
These factors directly influence KPIs in waste collection and describe the overall waste collection system. They are all contextual to local waste management practices. Most of the following described IFs can be directly influenced by the local waste management authority, while some of them cannot. Furthermore, it is appropriate to not only consider each IF per individual waste stream but to connect for example the respective IF of biowaste separate collection with the one of residual waste collection.
▼ Population and population density
Refer to the urban or rural structure of the waste collection area. They can also indicate the prevailing housing structure, such as single-family homes or multi-family dwellings. These factors are not directly influenced by the local waste collection authority.
▼ Target waste category
Refers to the type of biowaste targeted by the separate collection system, depending on the local collection concept. Systems may focus on the separate collection of food waste only, or on the co-mingled collection of food and garden waste (biowaste).
Categories: Food waste collection, Green waste collection, Biowaste collection
▼ Collection mode
Refers to the basic arrangement of the waste collection system. It defines whether waste generators set out their waste at the kerbside or bring it to designated collection locations. Mixed systems may also occur within the same collection area, for example where door-to-door collection in rural neighbourhoods is combined with bring points in the densely populated city centre. The collection mode also determines the relevance of other influencing factors, as some system characteristics only apply, or are more relevant, to specific collection arrangements.
Categories: Door-to-door, Bring point, Recycling centre, Mixed, No separate collection
▼ Collection frequency
Refers to the regular collection of a specific waste stream and describes the total number of collections per year. Collection frequencies may be fixed throughout the year, vary seasonally, or be fixed-flexible, where the waste generators can choose from predefined options provided by the waste management authority.
Categories: Numerical value expressed as number of collections per year and the average number of collections per week.
▼ Fee system
Waste fees are charges paid by households and similar for the provision of municipal waste collection and treatment services. The fee system describes how these charges are calculated and whether residents can influence them through their choice of use of the service.
The fee system was defined into five categories. These involve the increasing degrees of freedom for the residents to adjust their waste fees. A Flat fee applies the same costs irrespective of individual use. A Flexible system links the fee to the selected bin size for a given waste stream. A Flexible+ system additionally allows residents to pre-select a defined collection frequency. Pay as you throw (PAYT) links the fee directly to actual service use.
Categories: No fee, Flat fee, Flexible, Flexible+, Pay as you throw (PAYT)
▼ Access and use control
Refers to the technical ability of the waste management authority to monitor, regulate, or restrict the use of a collection system. Use control may include chipped containers, commonly based on RFID technology, which allow the use of individual containers to be recorded. Access control mainly applies to bring systems, where the use of the street containers can be restricted to authorised users or specific times. Such control mechanisms can also provide the technical basis for linking system use to waste fees, for example in pay-as-you-throw systems.
Categories: Yes, No
▼ Participation policy
Refers to whether separate collection of a given waste stream is required under local waste regulations or provided on a voluntary basis. In mandatory systems, exemptions may apply, for example where households provide evidence of home composting.
Categories: Voluntary, Mandatory, Mandatory with exception
▼ Population connection rate
Refers to the share of population connected to the separate collection of a given waste stream. In this study, it describes the share of the population connected to door-to-door biowaste collection. The calculation may vary between collection areas and can be based on inhabitants, households, residential properties, or the ratio of biowaste bins to residual waste bins. The population connection rate is closely connected to the participation policy.
Category: Numerical value expressed as the percentage (%) of the population with access to biowaste collection.
▼ Collection container configuration
Refers to the technical design of the kerbside collection containers and the way different waste streams are organised for collection. Configurations may include separate containers for each waste stream, shared containers used on different collection days or for colour-coded bags for optical sorting, or multi-compartment bins. The selected configuration can reflect local conditions, such as settlement structure, available space, collection distances, and the need to optimise collection logistics. It may also require corresponding adaptations to collection vehicles and sorting infrastructure.
Categories: Single containers, two-compartment bins, four-compartment bins, optical bag sorting
▼ Minimum bin volume provided
Refers to the smallest kerbside container volume available to waste generators for a given waste stream. Where bin size is linked to the fee system, residents may adapt the selected volume to their needs. Minimum bin volume can influence the convenience and capacity of separate collection. Small biowaste bins may limit the disposal of bulky garden waste and thereby support a stronger focus on food waste, while smaller residual waste bins compared with separate collection bins can support source separation. Bin volume should therefore be interpreted in relation to collection frequency and in comparison with the volume provided for residual waste.
Categories: Numerical value expressed as bin volume in litres (L).
▼ Allowed and forbidden materials
Refers to the materials explicitly accepted as compliant or forbidden as non-compliant from a given waste stream, usually as defined in local sorting guidelines. For biowaste, this may include specific food waste and garden waste fractions, as well as collection aids used to facilitate household collection and subsequently entering the biowaste stream. With regard to the KPIs assessed in this project, collection aids are considered part of the gross biowaste stream if they enter the collection system, but are not included in net biowaste quantities, which refer only to food waste and green waste. This factor is closely linked to the defined waste category, as it specifies the material scope of the collection system.
Categories 1 - Actual biowaste: Food waste, Green waste, including possible sub-categories.
Categories 2 - Collection aids: Paper-based, Biodegradable plastics-based, Conventional plastics-based, others.
Glossary
▼ Collection area
Refers to the geographical area in which waste collection is organised under a common collection system. A collection area is managed by one waste management entity, referred to as the collection organiser.
▼ Collection organiser
Refers to the waste management entity responsible for organising the collection system. In practice, this may be a municipality, regional authority, waste association or public-private company. The collection organiser is not necessarily the entity physically carrying out the collection, but the one defining the collection conditions and commissioning the service provider.
▼ Gross mass of a separately collected waste stream
Refers to the total quantity collected within a separately collected waste stream, including both compliant and non-compliant materials. This term is applied to target streams of separate collection, such as biowaste and green waste.
▼ Net mass of a separately collected waste stream
Refers to the quantity of compliant target materials collected within a separately collected waste stream. It excludes non-compliant materials, such as impurities in the biowaste stream.
For the residual waste stream, the terms gross and net are not used. Instead, specific material fractions within residual waste are described separately, for example the biowaste fraction remaining in the residual waste stream.
▼Organics
Refers to organic waste materials in direct relation to biowaste, including food waste and green waste. In this project, the term is used as a collective term for organic waste streams. It does not include collection aids, impurities or other carbon-based materials.
▼ Waste quantity classification
▼ Waste stream
Methodology of statistical analysis
Statistical analysis was used to describe the various datasets, compare key performance indicators between categories of influencing factors, and support the interpretation of results. Descriptive statistics and boxplots were used to summarise and visualise the distribution of the data. Statistical significance tests were applied to assess whether observed differences between groups were likely to be systematic rather than random. Effect sizes were used to complement significance testing by indicating the magnitude and practical relevance of observed differences.
▼ Statistical tests and significance levels
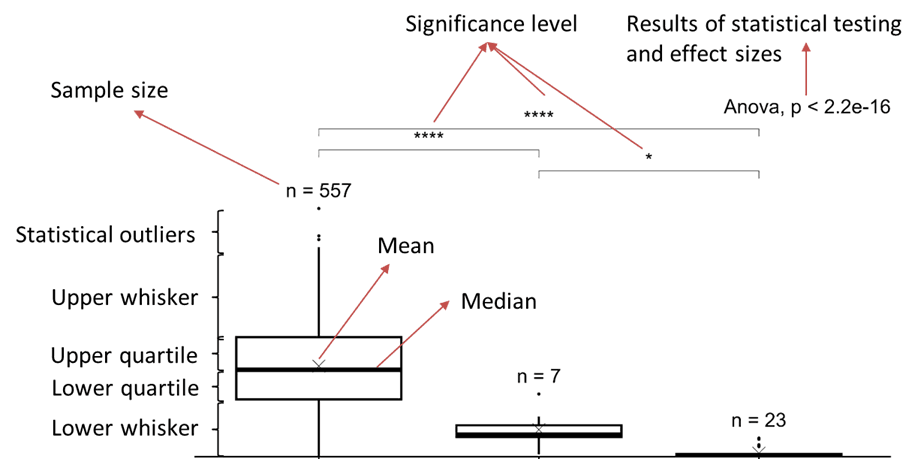
Statistical significance describes whether an observed difference is unlikely to have occurred by chance, based on a defined probability value (p-value). A lower p-value indicates stronger statistical evidence for a difference between groups. Significance levels, also in the boxplots, are indicated as follows:
ns = not significant; * = p ≤ 0.05; ** = p ≤ 0.01; *** = p ≤ 0.001; **** = p ≤ 0.0001.
t-test
The t-test compares the mean values of two groups. It was used to assess whether the difference between two categories was statistically significant. A significant result indicates that the observed difference is unlikely to be due to random variation alone. However, it does not indicate whether the difference is large or practically relevant.
ANOVA and post-hoc test
Analysis of variance (ANOVA) compares the mean values of more than two groups. It tests whether at least one group differs significantly from the others. If the ANOVA result is significant, post-hoc t-tests can be used to identify which specific group comparisons are statistically significant.
▼ Effect size
Effect size describes the magnitude of a difference or relationship. It complements significance tests by indicating how strong or relevant an observed effect is, for example the difference between categories of an influencing factor. This is important because a result can be statistically significant even when the actual difference between groups is small, especially in large datasets. The interpretation of effect sizes follows commonly used guidance.
Cohen’s d
Cohen’s d is used to describe the size of the difference between two group means, such as KPI values between two categories of an influencing factor. It is therefore suitable for pairwise comparisons, including t-tests or post-hoc comparisons between two categories. The value expresses the difference between the two means in relation to the variation within the data. As a general guide, values around 0.2 can be interpreted as small, around 0.5 as medium, and around 0.8 as large effects.
Eta squared (η²)
Eta squared is used to describes how strongly an influencing factor is associated with differences in a KPI across multiple categories. It is therefore suitable for ANOVA, where more than two groups are compared. Higher η² values indicate that a larger share of the observed variation is associated with the tested influencing factor. As a general guide, values around 0.01 can be interpreted as small, around 0.06 as medium, and around 0.14 as large effects.
▼ Correlation coefficient (r) and R2
Correlation analysis was used to assess the relationship between numerical variables, such as KPI values and an influencing factor based on numerical data. The correlation coefficient r describes the direction and strength of a linear relationship and ranges from -1 to +1. Positive values indicate that both variables tend to increase together, while negative values indicate that one variable tends to decrease as the other increases. As a very general guide, r values of ± 0.1 can be interpreted as weak, around ± 0.3 as moderate, and around ± 0.5 as strong correlations1. R2 is the squared correlation coefficient and describes the share of variation in one variable that can be explained by the other. Guidance on the use and interpretation of correlation coefficients is provided by Schober et al. (2018).
The thresholds for effect sizes should be interpreted as guidance rather than strict rules, as practical relevance depends on the research context.
▼ Interpretation of boxplots
Boxplots were used to visualise the distribution of KPI values across the categories of specific influencing factors. The following figure explains the general structure of the boxplot figures shown in the factsheets and indicates how the main graphical elements should be interpreted.
Authors and Citation
The project and its results were authored by Steffen Walk1, Phillipp Lüssenhop2, Isabel Martin1, Dr. Stefanie Siebert1 and Dr.-Ing. habil. Ina Körner2.
1European Compost Network ECN e.V., Im Dohlenbruch 11, 44795 Bochum, Germany
2Hamburg University of Technology, Bioresource Management Group, Eißendorfer Straße 40, 21073 Hamburg, Germany
If you wish to cite the published documents, please use the following format:
Walk, S. Lüssenhop, P., Martin, I., Siebert, S., Körner, I. (2026). BRIT-EU Project - Integrated information and management tool for the potential analysis of biowaste in the EU. European Compost Network ECN e.V. & Hamburg University of Technology. https://www.compostnetwork.info/brit-eu/
Acknowledgements
The BRIT-EU project team would like to express its sincere gratitude to all contributors who supported the project across Europe. We are particularly grateful to Angelika Blom (Avfall Sverige), Alberto Confalonieri and Michele Giavini (Consorzio Italiano Compostatori), Francesc Giró i Fontanals (Agència de Residus de Catalunya), Gemma Nohales (Entorna3), Vera Reppold (Landesamt für Natur, Umwelt und Klima NRW), as well as the many waste management authorities in Germany that provided valuable data, technical input, and practical insights.