Introduction
| Reference year | 2024 |
| Population (-) | 539,386 |
| Population density (inhabitants per km2) | 73 |
| Number of distinct collection areas (-) | 116 |
| Number of collection organisers (-) | 14 |
| Amount of separately collected organics streams (t per year): | 66,767 |
| ↳ Thereof biowaste waste stream (t per year) | 42,613 |
| ↳ Thereof green waste stream (t per year) | 24,154 |
| Amount of collected residual waste (t per year) | 79,234 |
| Total organics streams separation rate (%) | 45.7 |
| Biowaste stream separation rate (%) | 35 |
| Approximated net biowaste separation rate (%) | 82-902 |
| Biowaste recycling rate (%) | - |
| Total recycling rate (%) | 51 |
Note: Key Performance Indicators and Influencing Factors are defined on the project website: Link
Waste collection organisation in the Province of Bolzano – South Tyrol
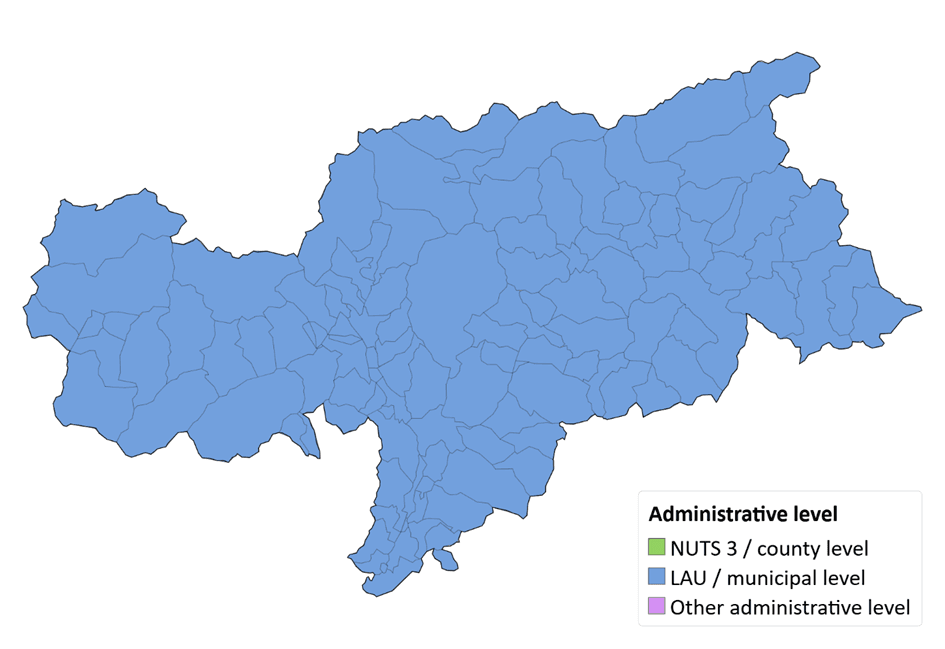
As shown in Figure 1, the Province of Bolzano – South Tyrol has distinct waste collection areas only at the municipal level with a total number of 116.
Infobox 1: Waste management organisation in the Bolzano Province
The Province of Bolzano – South Tyrol is responsible for the overall planning framework for waste management. Municipalities have statutory responsibility for the collection and transport of municipal waste, while the seven district associations (DE: Bezirksgemeinschaft, IT: Comunità Comprensoriale) organise supra-municipal services. Some municipalities, including Bolzano/Bozen, Merano/Meran and Bressanone/Brixen, organise their waste management services entirely independently.
Biowaste stream quantities
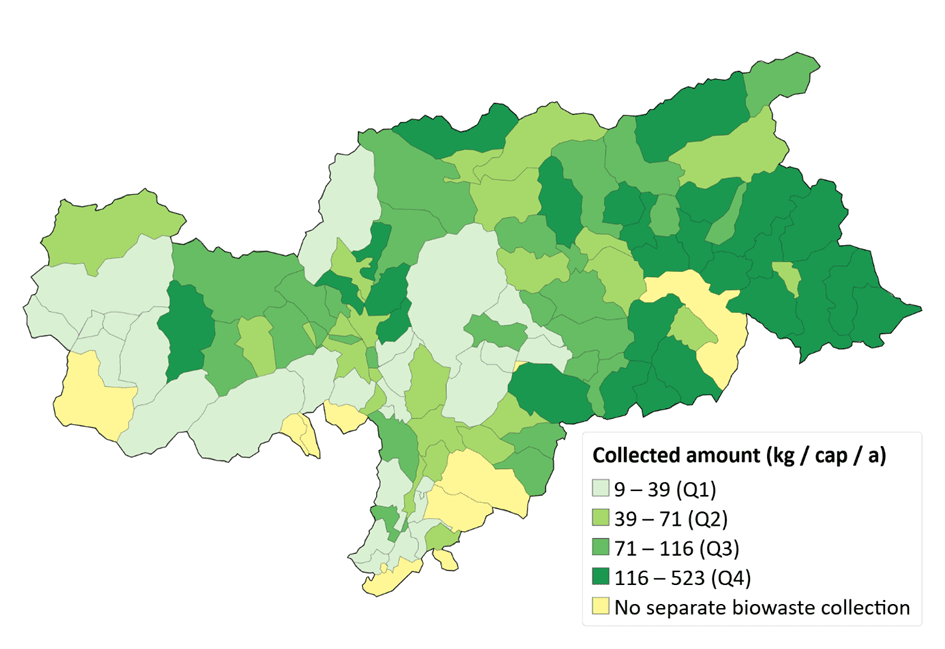
The mean quantity of separately collected biowaste was 87 ± 73 kg per inhabitant and year (median = 71), with a minimum of 9, and a maximum of 523, indicating a broad variation of separate collection performance (Figure 2).
Infobox 2: Separate collection and treatment of biowaste in the Bolzano Province
Separate management of organic waste has been required under Italian law since the end of 2021 . Biowaste must either be separated and recycled at source, including through home composting, or collected separately.
Collection is mainly organised door-to-door, although households in several municipalities must take their assigned bins designated proximity collection points for emptying. For consistency, these systems are treated as door-to-door, as the bins remain assigned to individual households and therefore differ from conventional bring systems using shared, non-assigned containers. Additional collection for green waste is available in most collection areas.
Door-to-door separate collection of biowaste is offered to 75.2% of the population (72 collection areas), with some part, especially in the centres of the larger cities, being offered a bring system. 8.1% of the population (9 areas) have a bring point system while 13.6% have to bring their biowaste to a central municipal recycling centre (24 areas). 3.1% of the population are not offered any option for separate collection of biowaste. Residual waste is collected door-to-door from most households (99.1% of the population).
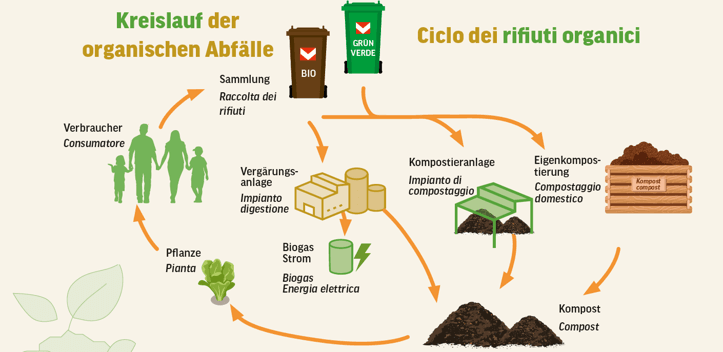
Figure 3 shows the overall concept of biowaste management. The future aim is to direct all separately collected food waste to anaerobic digestion and green waste to composting, which requires targeted collection of both waste streams (see fact sheet). The province also aims to treat digestate locally, as it has previously been transported outside of South Tyrol. A pilot action within the scope of the Interreg CORE project is testing this approach .
Residual waste stream quantities
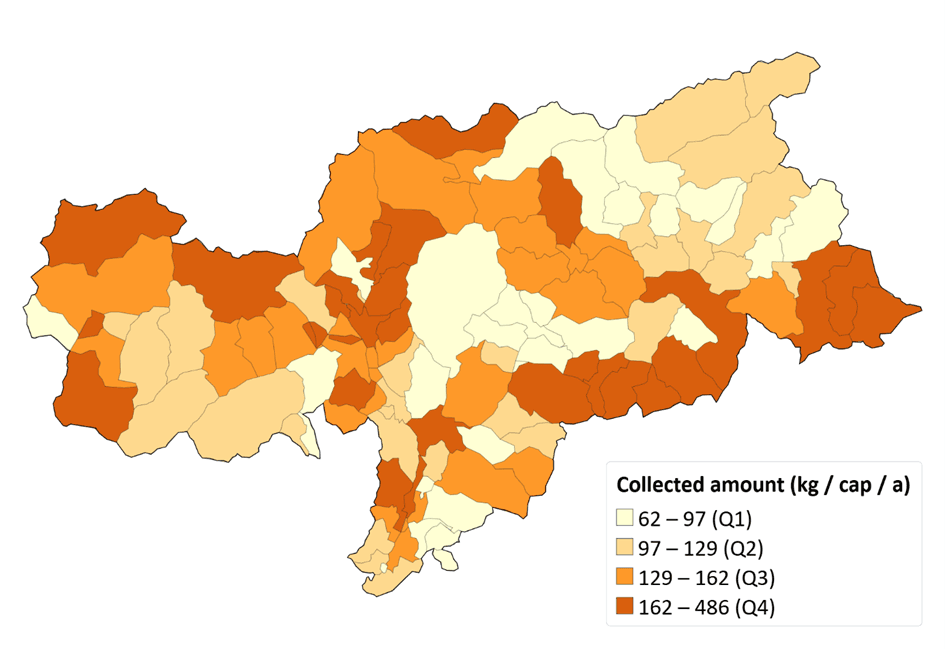
The mean quantity of collected residual waste was 145 ± 78 kg per inhabitant and year (median = 129), with a minimum of 62, and a maximum of 486 (Figure 4).
Biowaste stream separation rate
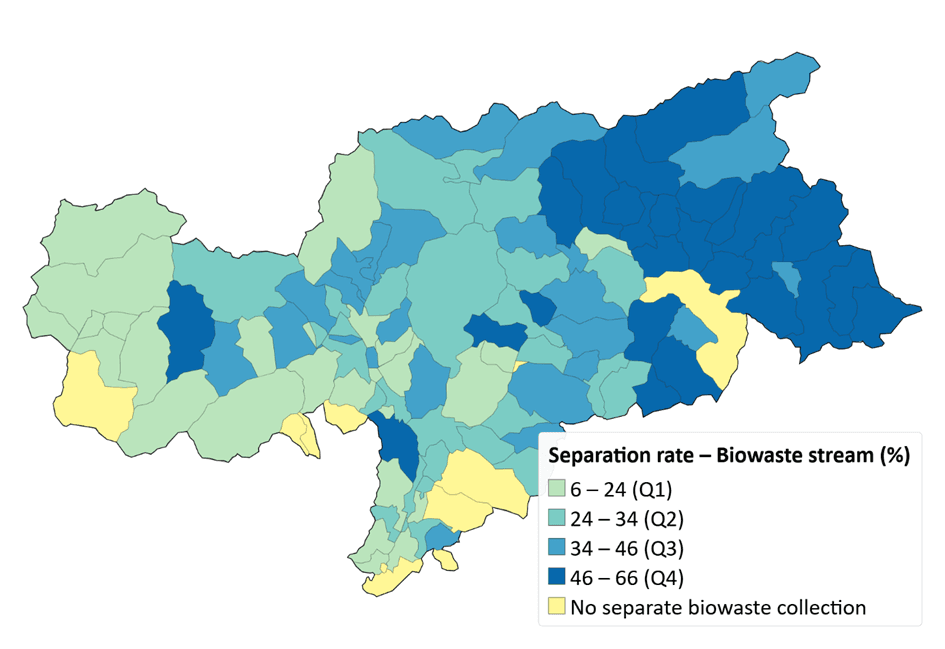
The biowaste stream separation rate (SRBW,gross) indicates for most collection areas a residual-bin-dominant collection (Figure 5). Mainly located in the eastern part of the province, there are 21 municipalities (14% of population) collecting a larger share of waste via the biowaste bin compared to the residual waste stream (SR ≥ 50%).
The mean SRBW,gross was 35 ± 15 % (median = 34), with a minimum of 6, and a maximum of 66.
Biowaste in residual waste stream
Residual waste analyses were only available as aggregated data for the eight district associations, rather than for individual collection areas. However, the underlying composition analysis was based on a large number of samples.
The mean quantity of biowaste in the residual waste stream was 10.5 ± 3.2 kg per inhabitant and year (median = 9.1), with a minimum of 7.3 and a maximum of 15.4.
Approximated net biowaste separation rate
The approximated net biowaste separation rate (SRBW,approx-net) was estimated from the residual waste composition analyses date. Results confirm a biobin-dominant collection of approximated biowaste. The mean SRBW,approx-net was 85% (median = 85%), with a minimum of 75% and a maximum of 93%.
Infobox 3: Estimating material-based biowaste separation rates from waste-stream KPIs
A strong correlation was observed between the gross biowaste stream separation rate and the approximated net biowaste separation rate. The relationship and its potential use for estimating material-based performance are examined in a separate cross-case technical note.
Associated Fact Sheets
→ Click on the tiles to read or download the full factsheet