
Introduction
| Reference year | 2024 |
| Population (-) | 4,129,569 |
| Population density (inhabitants per km2) | 208 |
| Number of distinct collection areas (-) | 32 |
| Amount of separately collected organics streams (t per year): | 727,179 |
| ↳ Thereof biowaste waste stream (t per year) | 341,073 |
| ↳ Thereof green waste stream (t per year) | 386,106 |
| Amount of collected residual waste (t per year) | 596,839 |
| Total organics streams separation rate (%) | 54.9 |
| Biowaste stream separation rate (%) | 36.4 |
| Approximated net biowaste separation rate (%) | 64.7 |
| Biowaste recycling rate (%) | 97.1 |
| Total recycling rate (%) | 63.9 |
Note: Key Performance Indicators and Influencing Factors are defined on the project website: Link
Waste collection organisation in Rhineland-Palatinate
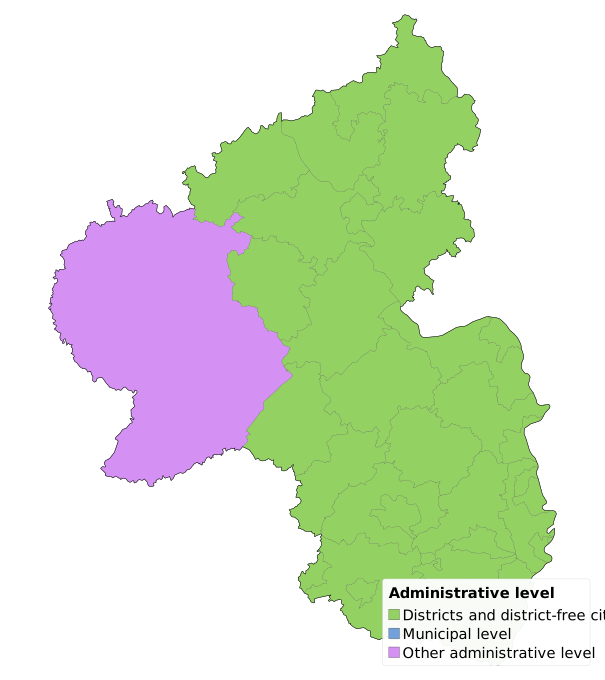
Waste collection in Rhineland-Palatinate (RLP) is mainly organised at district level (Figure 1), as common in most of Germany. Only in the western part of the region, waste collection areas are aggregated into one supra-district organisation comprising four districts and the district-free city of Trier (see Infobox 1). In total, there are 32 distinct collection areas.
Infobox 1: Waste management organisation in Rhineland-Palatinate
In RLP, responsibilities are divided between different administrative levels under its State Circular Economy Act. The state government defines the legal and strategic framework through the State Waste Management Plan. The 24 districts and 12 district-free cities (NUTS 3 level) are generally responsible for the municipal waste management. However, responsibilities may also be transferred to regional waste management associations, such as A.R.T. in the Trier.
The responsible authorities determine the local collection systems, fees and other service arrangements within the boundaries of the state framework. Each one has reporting obligations to the state, and must prepare annual waste statistics and review their performance against the targets of the State Waste Management Plan.
RLP has established a particularly ambitious waste management framework across Germany, combining measurable targets and regular monitoring with a broader strategy for circular economy. This includes, among others, frequent compositional analyses of residual waste, cluster-specific maximum quantities of recyclable fractions in the residual waste stream, and requirements to review further measures where the targets are not met. The results of the compositional analyses are publicly available in an annually updated report including the waste management profiles of each individual collection area.
Biowaste stream quantities
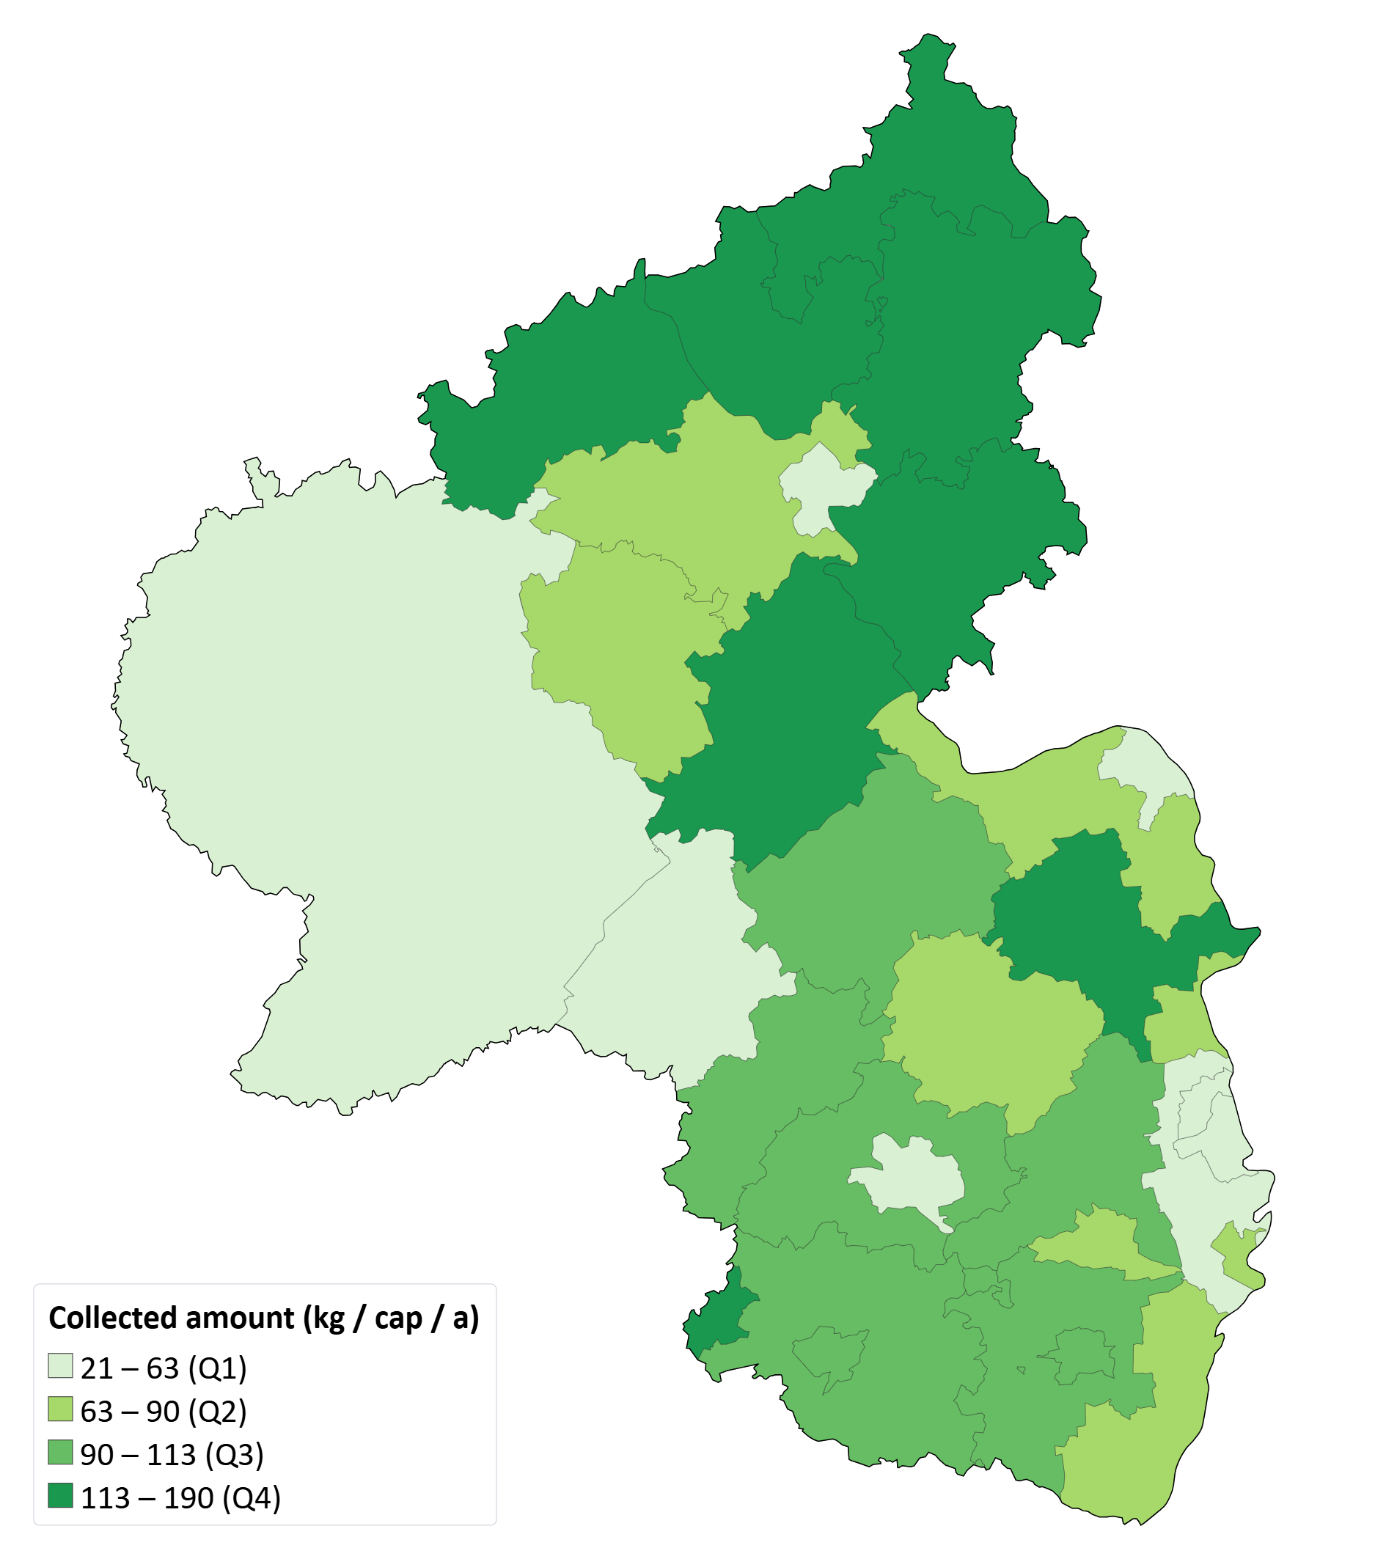
The mean quantity of separately collected biowaste was 90 ± 37 kg per inhabitant and year (median = 90), with a minimum of 21, and a maximum of 190 (Figure 2).
Infobox 2: Separate collection of biowaste in Rhineland-Palatinate
Separate collection of biowaste is mandatory under the German Circular Economy Act since 2015. In RLP, there is no uniform state-wide requirement for a mandatory biobin. Collection systems and participation policies are defined by the individual public waste management authorities. However, the State Waste Management Plan gives priority to increasing the connection rate and states that home composting should generally not lead to a full exemption from separate collection. Several authorities have already introduced a mandatory biobin, including for households practising home composting.
As in most of Germany, food waste and garden waste are collected as commingled biowaste in RLP. In addition, most districts provide bring schemes for green waste. Residual waste is collected door-to-door from all households in RLP.
Door-to-door separate collection of biowaste is available to 84.8% of the population, covering 30 collection areas. For 15.2% of the population, only bring schemes using open street containers are available (2 areas), mainly in western RLP. These areas also report the lowest biowaste collection quantities (Figure 2) and the highest residual waste quantities (Figure 3).
Separate collection performance is assessed primarily through the amount of biowaste remaining in the residual waste stream rather than the stream’s total quantity alone. By 2030, this should not exceed 20 kg per inhabitant and year in rural and semi-urban areas and 28 kg in urban areas. Therefore, representative residual waste composition analyses should be conducted at least every five years. In addition, the state aims for all biobin waste to undergo anaerobic digestion followed by material recycling, generally through composting, by 2035. Currently, approximately 80% of the biobin waste undergoes anaerobic digestion as the first treatment step.
Residual waste stream quantities
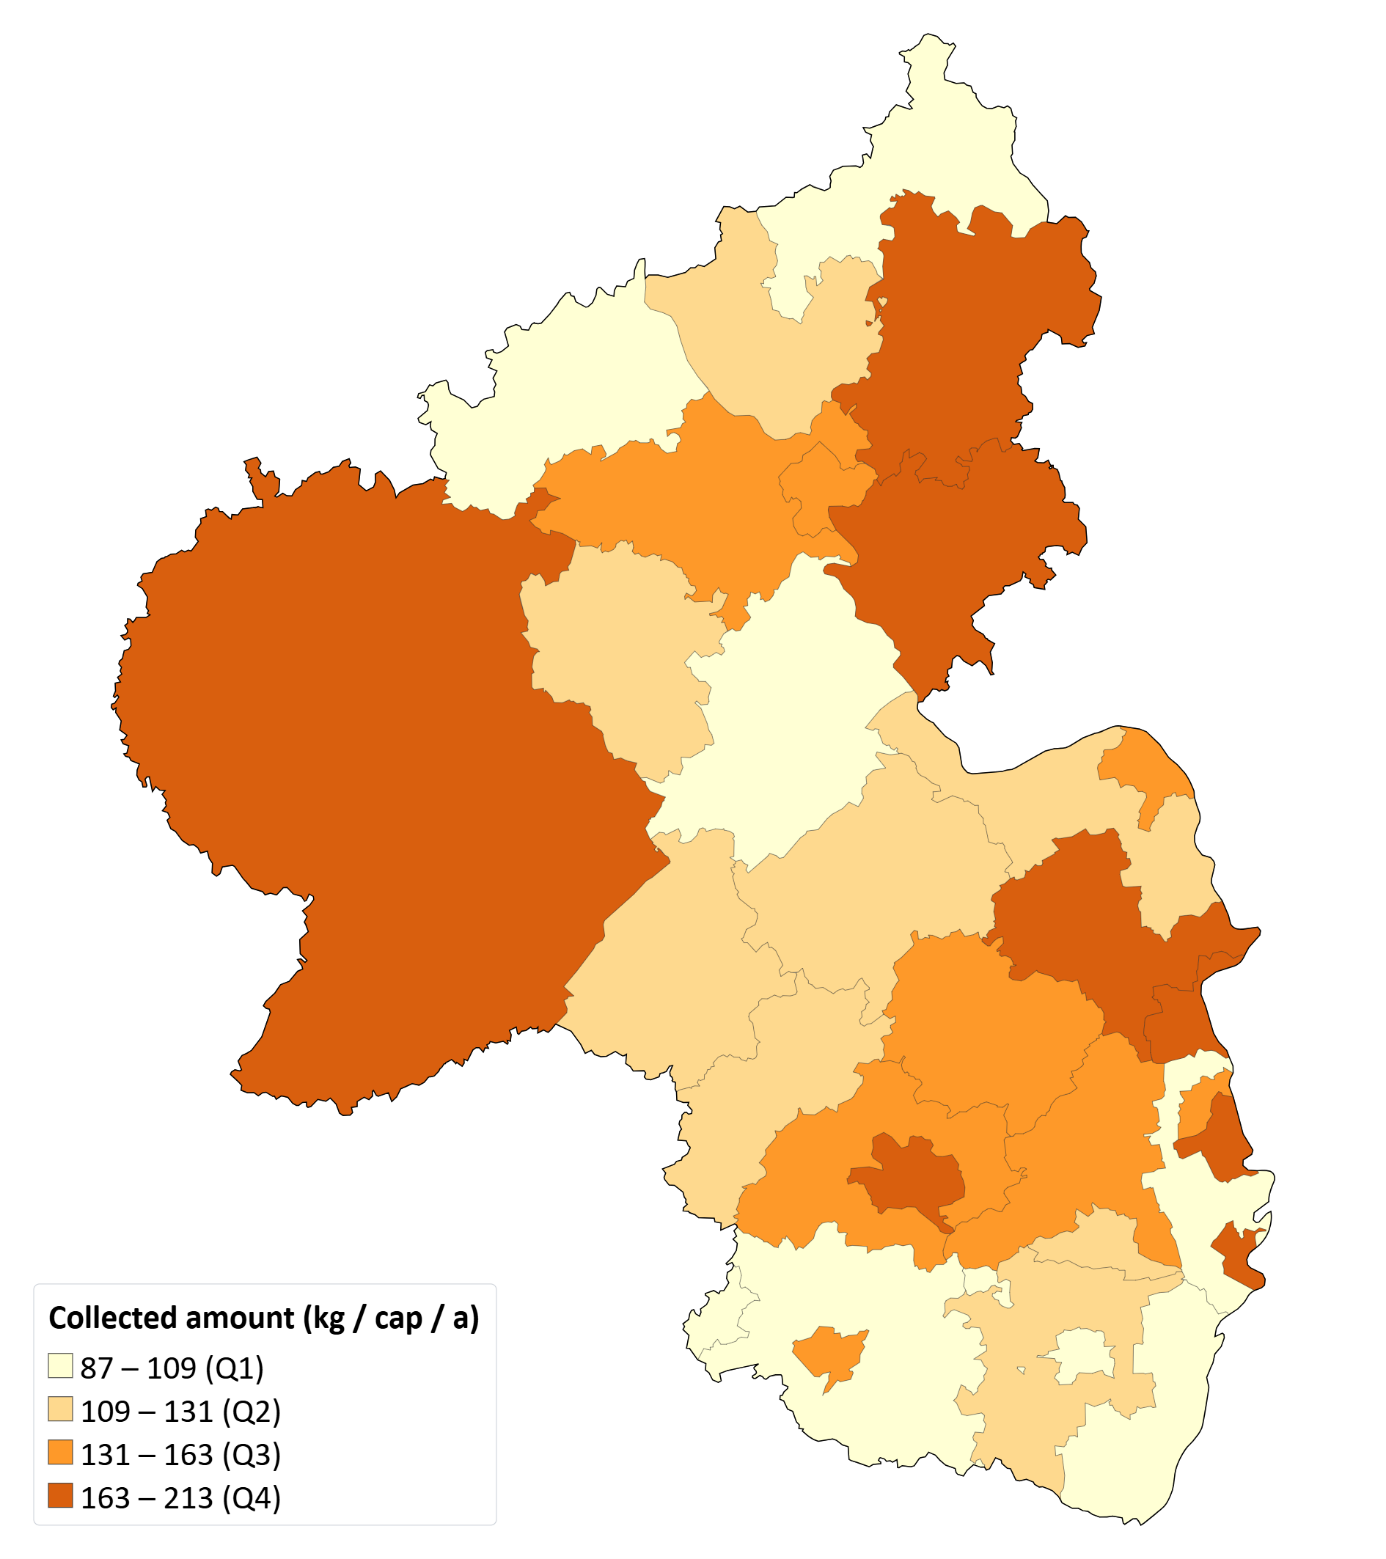
The mean quantity of collected residual waste was 139 ± 35 kg per inhabitant and year (median = 131), with a minimum of 87 and a maximum of 213 (Figure 3).
Biowaste stream separation rate
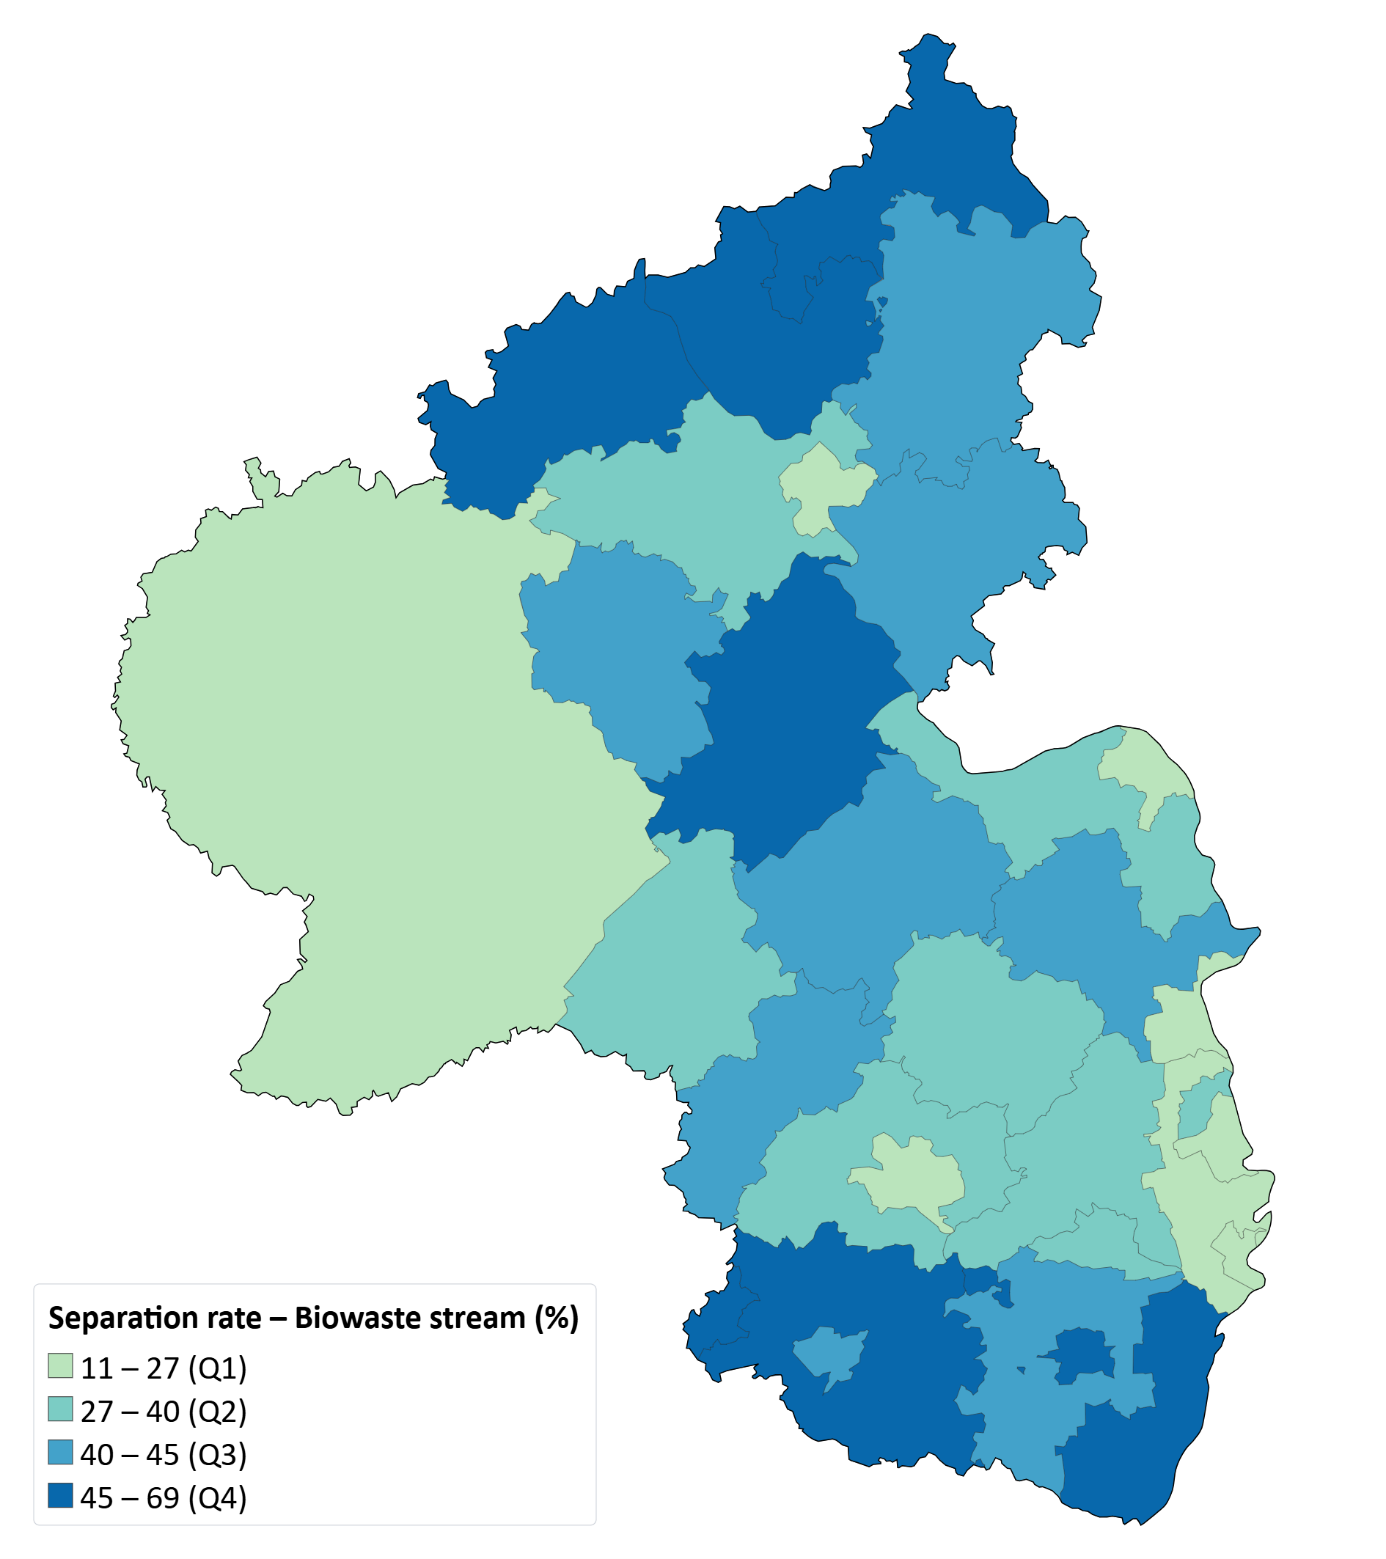
The biowaste stream separation rate (SRBW,gross) indicates for most collection areas a residual bin dominant collection (Figure 4). The mean SRBW,gross was 39 ± 14% (median = 40%), with a minimum of 11%, and a maximum of 69%.
Biowaste in residual waste stream
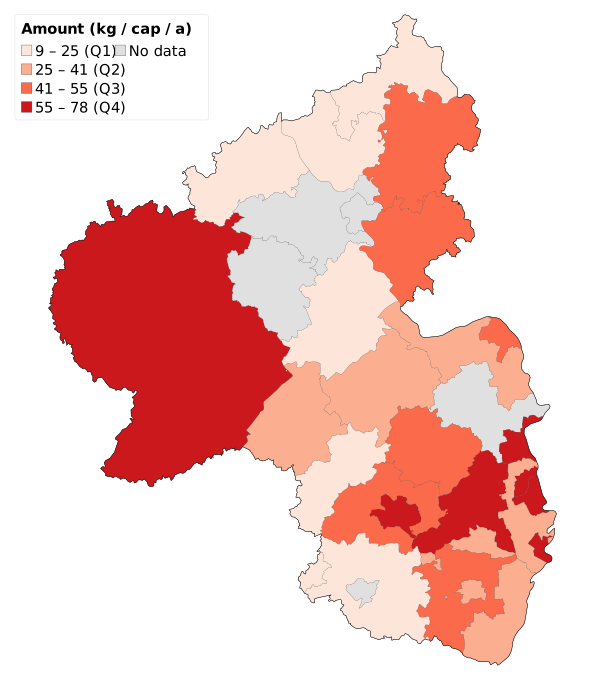
The mean quantity of biowaste in the residual waste stream identified in compositional analyses was 42 ± 21 kg per inhabitant and year (median = 41), with a minimum of 9 and a maximum of 78 (Figure 5).
Approximated net biowaste separation rate
The approximated net biowaste stream separation rate (SRBW,approx-net) indicates for most collection areas a biowaste-stream-dominant collection, with 20 districts (64 % of population) collecting more than 50% of the biowaste separately.
The mean SRBW,approx-net was 66 ± 19% (median = 66%), with a minimum of 23%, and a maximum of 95%.
Infobox 3: Estimating material-based biowaste separation rates from waste-stream KPIs
A strong correlation was observed between the gross biowaste stream separation rate and the approximated net biowaste separation rate. The relationship and its potential use for estimating material-based performance are examined in a separate cross-case technical note.
Associated Fact Sheets
→ Click on the tiles to read or download the full factsheet
